
The need to conduct a one-sample t-test is much less frequent than the need to conduct a two-sample t-test. For that reason, it is easy to forget how to perform a one-sample t-test. Fortunately, I have created a guide for performing a one-sample t-test in Jamovi. As always, if you have any questions, please email me a MHoward@SouthAlabama.edu!
Before learning how to conduct a one-sample t-test in Jamovi, let’s briefly chat about its purpose. In general, a one-sample t-test is used to identify whether the mean value of a group is significantly different from a specified value (that you select). So, it may be used to answer research questions similar to the following:
- Is a class’s average grade significantly different than a value of 80?
- Is a group’s average height significantly different than 5’6″?
- Is a company’s yearly revenue significantly different than 10 million dollars?
These types of questions may be interesting, but they are honestly not all that common in research or practice. Often, selection an arbitrary value to test isn’t all that informative. However, I can think of a few examples in which a one-sample t-test may be useful:
- When you know a pre-defined value is important.
- When you have a certain expected value for a sample.
- When there is some common-sense value.
- When you are performing a replication study.
Of course, there are other situations in which a one-sample t-test may be useful, so keep your eyes our for these scenarios!
Now that we know what a one-sample t-test is used for, we can now calculate a one-sample t-test in Jamovi! To begin, open your data in Jamovi. If you don’t have a dataset, download the example dataset here. In the example dataset, we are comparing the test grades of Dr. Howard’s class and Dr. Smith’s class (separately) to a value of 80. This will determine whether the student’ average grades in the two classes are significantly different from a value of 80.
Also, this file is in .xls format, but Jamovi cannot open this format. To learn how to change this .xls file to a .csv file, which Jamovi can open, please click here. Also, the pictures below are a little small on the page. Click on the link above each picture to view a larger version of the picture in a new window.
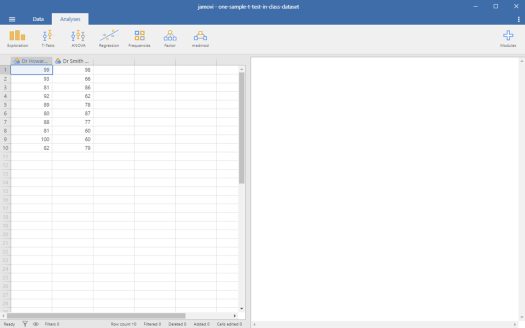
The data should look something like this:
One-Sample T-Test in Jamovi Picture 1
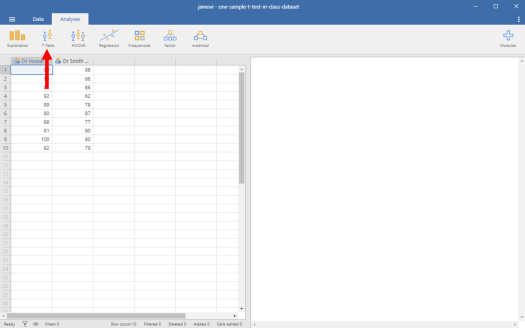
To conduct our one-sample t-test, we are first going to click on the “T-Tests” button at the top.
One-Sample T-Test in Jamovi Picture 2
Then click on “One Sample T-Test”.
One-Sample T-Test in Jamovi Picture 3

Now your window should look like this:
One-Sample T-Test in Jamovi Picture 4
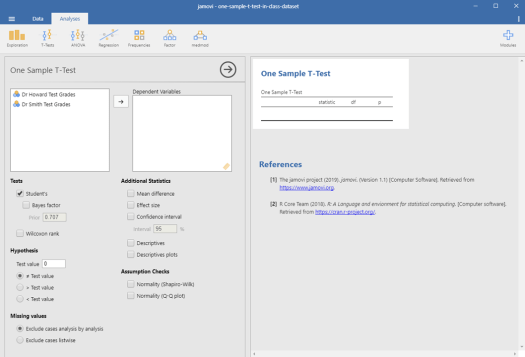
We want to assess the difference of Dr. Howard’s Test Grades from a value of 80, and we want to assess the difference of Dr. Smith’s Test Grades from a value of 80. Although these are two separate analyses, we can conduct them at the same time in Jamovi. To do so, we want to move the variables, Dr Howard Test Grades and Dr Smith Test Grades, into the “Dependent Variables” box. To do this, we can click on these variables, and then we click on the right-facing arrow next to the “Dependent Variables” box.
One-Sample T-Test in Jamovi Picture 5

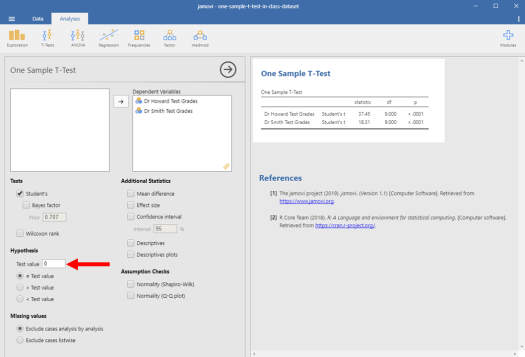
As you will see, Jamovi will instantly calculate results, but these results are not what we want. Instead, we need to first change the test value, which is the number that our groups will be compared to. By default, Jamovi has it set to 0, but we want to change it to 80. To do so, we click on the 0 in the “Test value” box, and we change it to 80.
One-Sample T-Test in Jamovi Picture 6
Lastly, one final piece of information would be helpful. Let’s tell Jamovi to also give us descriptive statistics regarding our two groups. To get these, click on the box next to “Descriptives”.
One-Sample T-Test in Jamovi Picture 7

And now we get our final results, as seen below:
One-Sample T-Test in Jamovi Picture 8
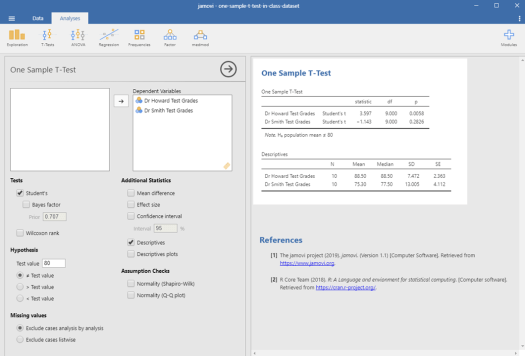
Let’s focus on Dr. Howard’s class at first. In the first table above, we can see that the p-value associated with Dr Howard Test Grades is .0058, which is much less than .05. That means that Dr. Howard’s Test Grades is significantly different from a value of 80. To see whether the class is higher or lower than a value of 80, we need to look at the second table. In this table, we see that Dr Howard test Grades had a mean of 88.5. So, not only was Dr. Howard’s Test Grades significantly different from a value of 80, it was significantly greater than a value of 80.
Now, let’s focus on Dr. Smith’s class. In the first table above, we can see that the p-value associated with Dr Smith Test Grades is .2826, which is much greater than .05. This means that Dr. Smith’s Test Grades is not significantly different from a value of 80. Because it is no different, we do not need to look at the second table or the mean.
But can we say that the average test grade in Dr. Howard’s class is significantly different than the average test grade in Dr. Smith’s class? Not with these analyses! To test this research question, we’d need to perform a two-sample t-test. Fortunately, I have already created a guide for this analysis in Excel, SPSS, R, and Jamovi. They can be found at the following links:
Well, that is all for one-sample t-tests! If you have any questions or comments, please email me a MHoward@SouthAlabama.edu. Thanks!
