
I often use two-sample t-tests as an introduction to R in my statistics courses. Because the students are still getting used to functions in R, they tend to have many difficulties with this lesson. For this reason, I created the page below to provide an easy-to-read guide on performing two-sample t-tests in R. As always, if you have any questions, please email me a MHoward@SouthAlabama.edu!
Before learning about two-sample t-tests in R, we must first know what a two-sample t-test is used for. The textbook definition says that a two-sample t-test is used to “determine whether two sets of data are significantly different from each other”; however, I am not a fan of this definition. Instead, I prefer to say that a two-sample t-test is used to “test whether the means of a measured variable in two groups is significantly different.” So, a two-sample t-test is used to answer questions that are similar to the following:
- In our sample, do women have better test grades than men?
- Are men taller than women?
- Do people in a class taught by Dr. Howard perform better on a test than those in Dr. Smith’s class?
- Do employees in Training Group A have better performance than Training Group B?
Now that we know what a two-sample t-test is used for, we can now calculate a two-sample t-test in R! To begin, open your data in R. If you don’t have a dataset, download the example dataset here. In the example dataset, we are comparing the test grades of two classes (Dr. Howard and Dr. Smith) to determine which class has higher grades on an exam. NOTE: This is a different version of this dataset than the Excel or SPSS guides. So, please redownload it if you downloaded it from these other guides.
Also, this dataset is in the .xlsx format, and the current guide requires the file to be in .csv format. For this reason, you must convert this file from .xlsx format to .csv format before you can follow along using this dataset. If you do not know how to do this, please visit my page on converting a file to .csv format. After converting the file, you can continue with this guide.
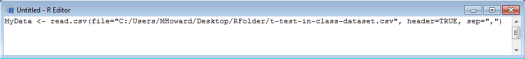
First, you must import your data to R. For the current examples, we are going to label our data as: MyData.
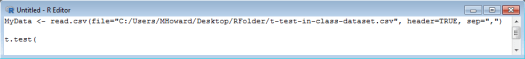
We are going to use the t.test() command, so please type t.test( .
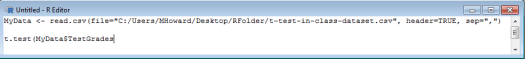
Now, the first variable that we enter will be the outcome variable, which is most often continuous when performing a two-sample t-test. In the current example, this variable is TestGrades. So, we will type: MyData$TestGrades .
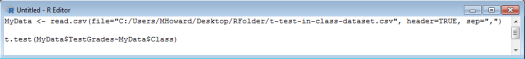
Lastly, we need to identify our grouping variable. For the current example, this is Class. Type in: ~MyData$Class) .
Run your syntax.

Did you get something like the output above? From this output, we can see that the p-value is less than .05. So, our results are statistically significant. Neat!
The results also provide the means of both groups. As you can see, Dr. Howard’s class had a higher mean than Dr. Smith’s class. So, we could say that the mean of Dr. Howard’s class was significantly greater than Dr. Smith’s class. And that’s all for performing a t-test!
I do have one last note, however. In the current example, our dataset had a grouping variable (Class) and an outcome variable (TestGrades). But what do you do if your dataset has a outcome variable for group 1 (e.g. HowardTestGrades) and an outcome variable for group 2 (e.g. SmithTestGrades)? Well, you would use the same command! In this case, instead of tryping ~, you would use a comma to separate the variables ( , ). The command would be: t.test(MyData$HowardTestGrades, MyData$SmithTestGrades) . So, before performing your analyses, you should look at your dataset to see how it is structured. If it is not to your liking, then you should reorder it using Excel or some other data management program.
Do you still have any questions? Or comments about this guide? Feel free to email me at MHoward@SouthAlabama.edu. I am always happy to chat!
