
I often use two-sample t-tests as an introduction to Jamovi in my undergraduate statistics courses – and sometimes my graduate courses, too. Because the students are still getting used to functions in Jamovi, they tend to have many difficulties with this lesson. For this reason, I created the page below to provide an easy-to-read guide on performing two-sample t-tests in Jamovi. As always, if you have any questions, please email me a MHoward@SouthAlabama.edu!
Before learning about two-sample t-tests in Jamovi, we must first know what a two-sample t-test is used for. The textbook definition says that a two-sample t-test is used to “determine whether two sets of data are significantly different from each other”; however, I am not a fan of this definition. Instead, I prefer to say that a two-sample t-test is used to “test whether the means of a measured variable in two groups is significantly different.” So, a two-sample t-test is used to answer questions that are similar to the following:
- In our sample, do women have better test grades than men?
- Are men taller than women?
- Do people in a class taught by Dr. Howard perform better on a test than those in Dr. Smith’s class?
- Do employees in Training Group A have better performance than Training Group B?
Now that we know what a two-sample t-test is used for, we can now calculate a two-sample t-test in Jamovi! To begin, open your data in Jamovi. If you don’t have a dataset, download the example dataset here. In the example dataset, we are comparing the test grades of two classes (Dr. Howard and Dr. Smith) to determine which class has higher grades on an exam.
Also, this file is in .xls format, but Jamovi cannot open this format. To learn how to change this .xls file to a .csv file, which Jamovi can open, please click here. Also, the pictures below are a little small on the page. Click on the link above each picture to view a larger version of the picture in a new window.
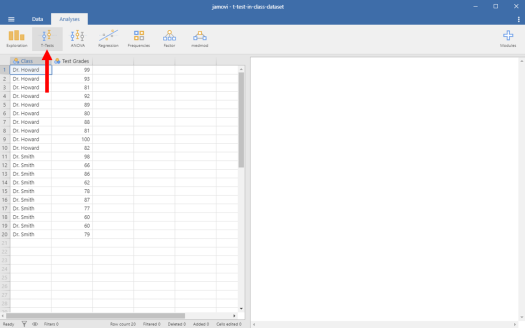
The data should look something like this:
Two-Sample T-Test in Jamovi Picture 1

To start, click on the “T-Tests” button at the top of the window.
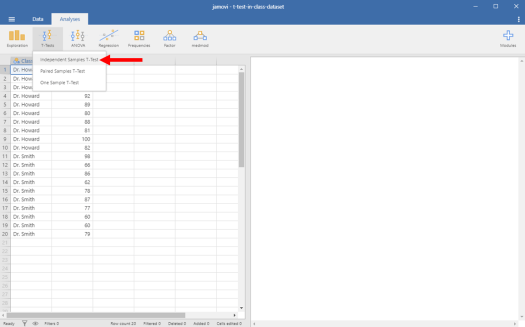
Two-Sample T-Test in Jamovi Picture 2
Now click on “Independent Samples T-Test”.
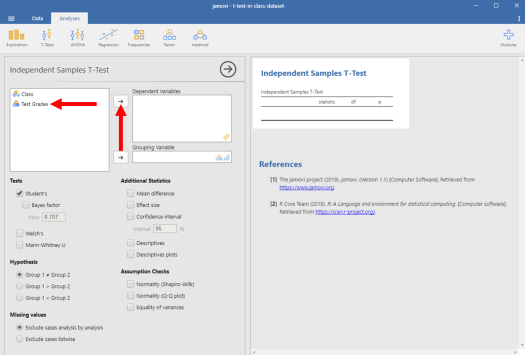
Two-Sample T-Test in Jamovi Picture 3
The following window should pop up.
Two-Sample T-Test in Jamovi Picture 4

To conduct our analyses, we want to designate Test Grades as our outcome variable in Jamovi. To do so, we want to click on Test Grades and then click on the right-facing arrow next to the “Dependent Variables” box.
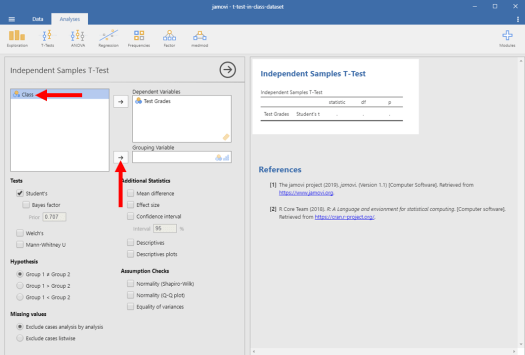
Two-Sample T-Test in Jamovi Picture 5
Then, we want to designate Class as our grouping variable in Jamovi. To do so, we want to click on Class and the click on the right-facing arrow next to the “Grouping Variable” box.
Two-Sample T-Test in Jamovi Picture 6
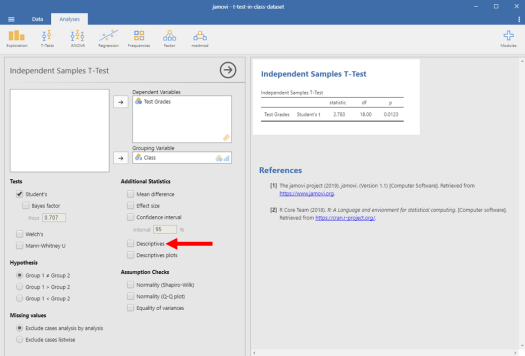
As you will see, Jamovi will then automatically calculate our results; however, there is another piece of information that we need before we should look at our results – the descriptive statistics. To obtain our descriptive statistics, we just click the box beside “Descriptives”.
Two-Sample T-Test in Jamovi Picture 7
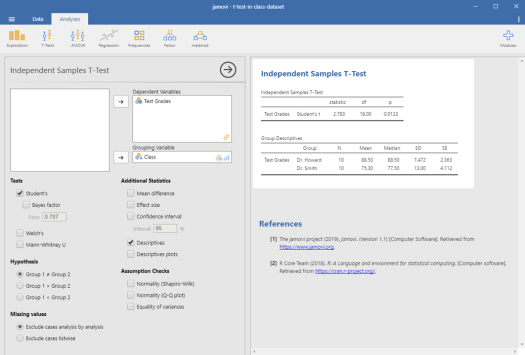
Now that we have our descriptive statistics, your results should look like the following:
Two-Sample T-Test in Jamovi Picture 8
Do your results look like this? If so, great! If not, go back and see where your results differed from my instructions.
To interpret these results, we should look at the p-value listed in the first table. It is .0123, which is less than .05. This means that our results are statistically significant, and there is a significant difference between the test scores of Dr. Howard’s class and Dr. Smith’s class. But, from this, we cannot tell which class had higher test scores.
To figure this out, we need to look at the descriptive statistics in the second table. Dr. Howard’s class had a mean of 88.5, whereas Dr. Smith’s class had a mean of 75.3. Because we know that the difference between these two classes were significant, we can now say that Dr. Howard’s class had significantly larger test scores than Dr. Smith’s class.
And that is all for two-sample t-tests in Jamovi! Do you still have any questions? Or comments about this guide? Feel free to email me at MHoward@SouthAlabama.edu. I am always happy to chat!
