
The need to conduct a one-sample t-test is much less frequent than the need to conduct a two-sample t-test. For that reason, it is easy to forget how to perform a one-sample t-test. Fortunately, I have created a guide for performing a one-sample t-test in SPSS. As always, if you have any questions, please email me a MHoward@SouthAlabama.edu!
Before learning how to conduct a one-sample t-test in SPSS, let’s briefly chat about their purpose. In general, a one-sample t-test is used to identify whether the mean value of a group is significantly different from a specified value (that you select). So, it may be used to answer research questions similar to the following:
- Is a class’s average grade significantly different than a value of 80?
- Is a group’s average height significantly different than 5’6″?
- Is a company’s yearly revenue significantly different than 10 million dollars?
These types of questions may be interesting, but they are honestly not all that common in research or practice. Often, selection an arbitrary value to test isn’t all that informative. However, I can think of a few examples in which a one-sample t-test may be useful:
- When you know a pre-defined value is important.
- When you have a certain expected value for a sample.
- When there is some common-sense value.
- When you are performing a replication study.
Of course, there are other situations in which a one-sample t-test may be useful, so keep your eyes our for these scenarios!
Now that we know what a one-sample t-test is used for, we can now calculate a one-sample t-test in SPSS! To begin, open your data in SPSS. If you don’t have a dataset, download the example dataset here. In the example dataset, we are comparing the test grades of Dr. Howard’s class and Dr. Smith’s class (separately) to a value of 80. This will determine whether the student’ average grades in the two classes are significantly different from a value of 80.
The data should look something like this:
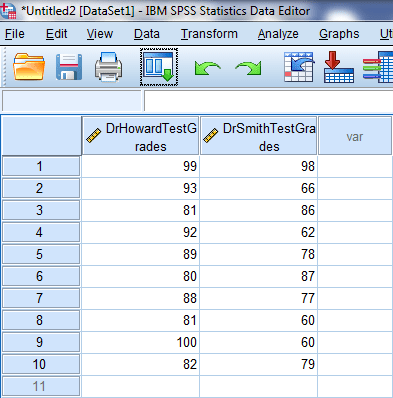
If it doesn’t, you may need to reformat your dataset. It may be difficult to follow along if your dataset looks differently.
We are first going to click on Analyze, Compare Means, and then One-Sample T-Test.
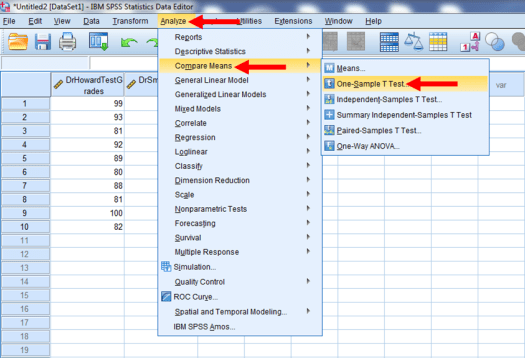
A new window should pop up, as seen below:

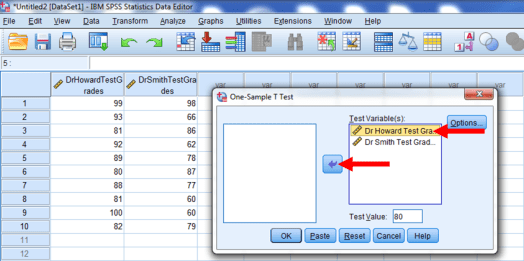
We are going to test Dr. Howard’s class first. So, click on Dr. Howard, and then click on the arrow highlighted below.

Dr. Howard’s class should now appear in the Test Variables box.
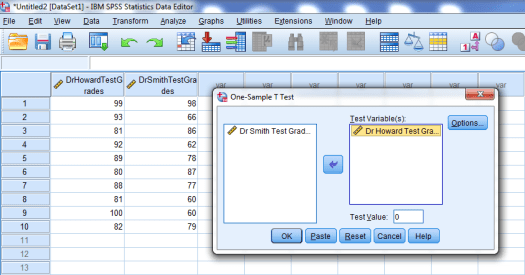
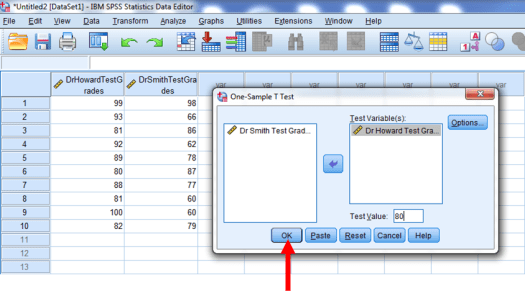
We will then enter a value of 80 into the Test Value box.

Click OK.
As apparent from the results, the p-value is .006. Because it is less than .05, we can identify that the mean test grade of Dr. Howard’s class is significantly different from a value of 80. Neat!

Now, let’s test Dr. Smith’s class. Again, go to Analyze, Compare Means, and One-Sample T-Test.

We can see that Dr. Howard’s class is still in the Test Variable box. That’s okay. We’ll deal with it later.

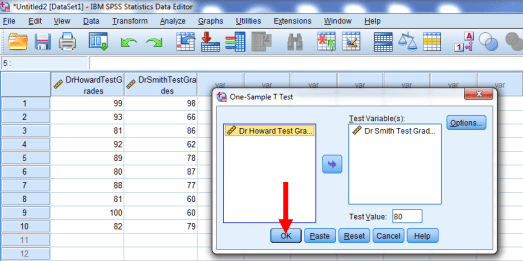
Click on Dr. Smith’s class, and then click on the arrow highlighted below.

Now, click on Dr. Howard’s class, and click on the same arrow.
We should now have only Dr. Smith’s class in the Test Variables box. If so, press OK.
Again, we should hopefully get results. The resultant p-value is .283, which is not statistically significant (p > .05). So, we cannot say that the average test grade of Dr. Smith’s class is significantly different than a value of 80.

But can we say that the average test grade in Dr. Howard’s class is significantly different than the average test grade in Dr. Smith’s class? Not with these analyses! To test this research question, we’d need to perform a two-sample t-test. Fortunately, I have already created a guide for this analysis in Excel, SPSS, R, and Jamovi. They can be found at the following links:
Well, that is all for one-sample t-tests! If you have any questions or comments, please email me a MHoward@SouthAlabama.edu. Thanks!
