
Most analyses that I review on MattCHoward.com involve direct effects alone; that is, the direct relationship between a predictor and an outcome, such as job satisfaction predicting job performance. Sometimes we want to test, however, whether a variable influences the relationship between two other variables, such as whether agreeableness influences the relationship between job satisfaction and job performance. We call this a moderated or interactive effect, and it can be tested in Jamovi. This page will teach you just how to do that. If you have any questions after reading, feel free to email me at MHoward@SouthAlabama.edu.
A moderating variable influences the relationship of two other variables. For instance, when people’s agreeableness is low, the relationship between job satisfaction and job performance may be almost nonexistant. When their agreeableness is high, however, the relationship between job satisfaction and job performance may be positive and extremely strong. In this case, we have more than just direct effects at play – we also have moderating effects (aka interactive effects). Some other questions that you may investigate when testing moderating effects may be:
- Does the relationship between conscientiousness and job commitment depend on tenure?
- Does the relationship between R&D funding and profit depend on company size?
- Does the relationship between stress and alcohol use depend on age?
The most basic type of moderation analysis in Jamovi includes a single predictor, a single moderator, and a single outcome. Of course, this is where we will start. If you don’t have a dataset, you can download the example dataset here. In this dataset, we are investigating the direct effect of Job Satisfaction on Performance, and we are also testing whether Agreeableness moderates this relationship.
Also, this file is in .xls format, but Jamovi cannot open this format. To learn how to change this .xls file to a .csv file, which Jamovi can open, please click here. Also, the pictures below are a little small on the page. Click on the link above each picture to view a larger version of the picture in a new window.
Further, this guide uses the medmod module in Jamovi. If you haven’t installed this module yet, you will need to do so. Please click here to discover how to install modules in Jamovi.
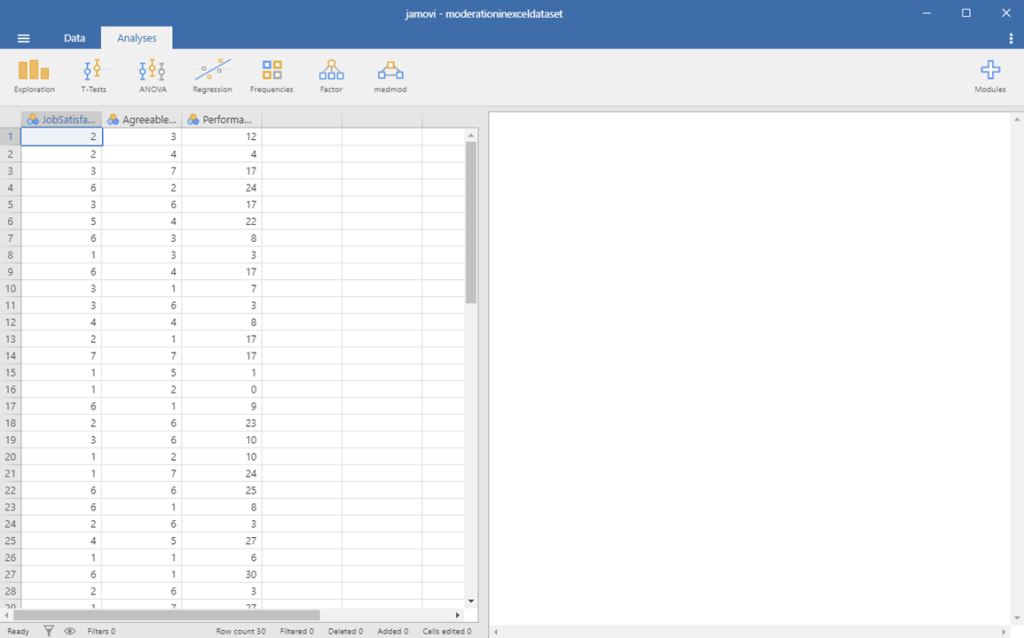
The data should look something like this:
Moderation in Jamovi Picture 1
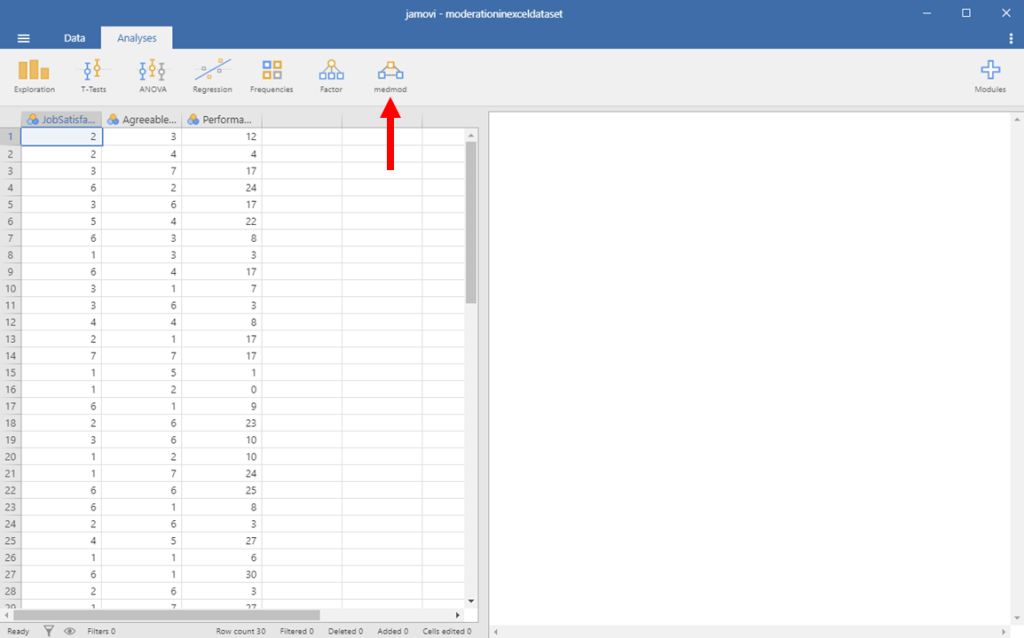
Typically, we would need to mean-center our predictor and moderator. Fortunately, Jamovi will do this for us. Neat! So, we can just go ahead and click on the medmod button, as seen below:
Moderation in Jamovi Picture 2
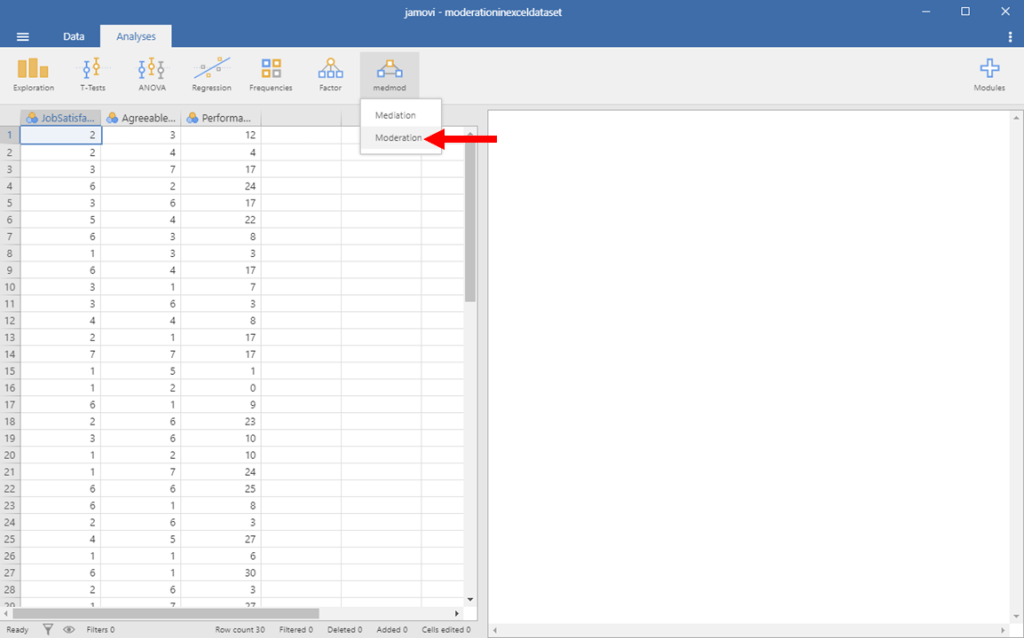
Click on the button that says moderation.
Moderation in Jamovi Picture 3
Now, the window seen below should appear.
Moderation in Jamovi Picture 4
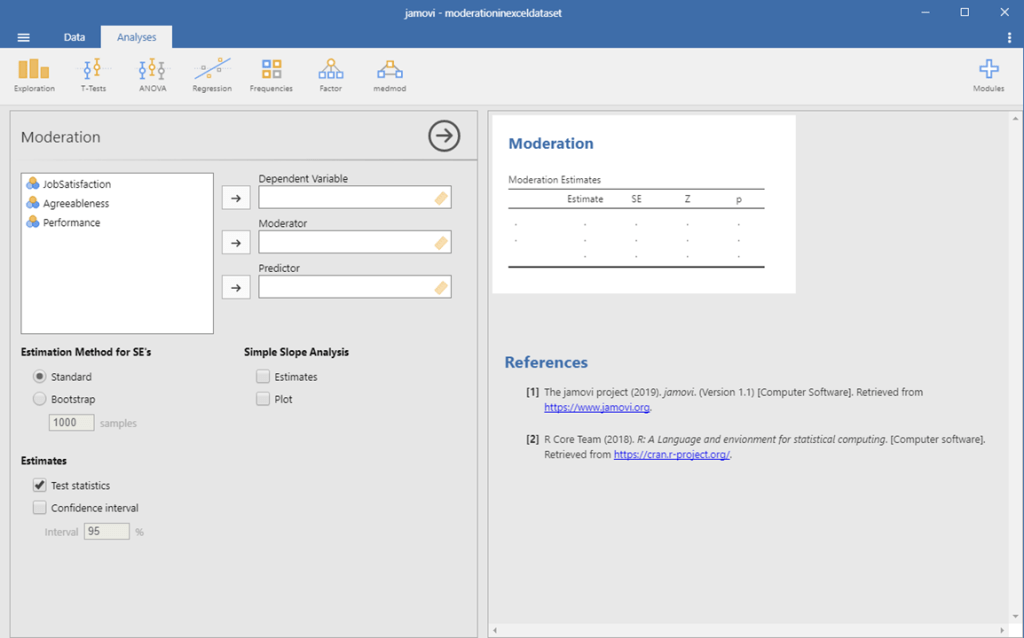
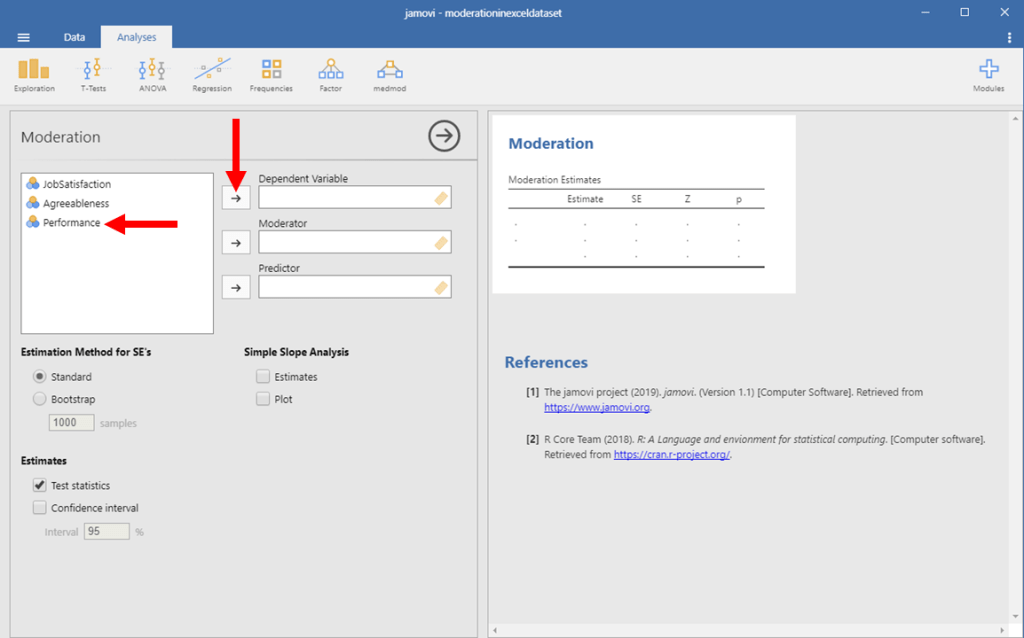
We first want to identify our outcome variable in Jamovi. In this example, it is performance. So, you want to click on the Performance variable, and then click on the right-facing arrow next the the Dependent Variable box.
Moderation in Jamovi Picture 5
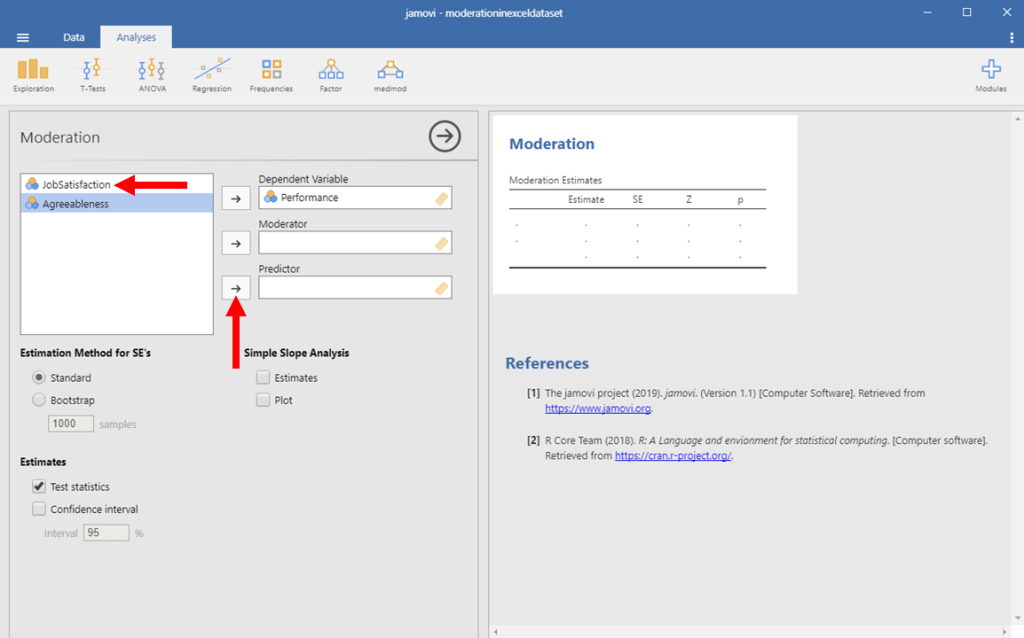
Next, we want to identify our predictor. In this example, it is Job Satisfaction. So, click on your Job Satisfaction variable, and then click on the right-facing arrow next to the Predictor box.
Moderation in Jamovi Picture 6
Lastly, we want to identify our moderator, which is Agreeableness in this example. Again, to do this, we want to click on the right-facing arrow next to the moderator box.
Moderation in Jamovi Picture 7

We should get results. Awesome! First, let’s get one last part of information. We won’t use it in this example, but a lot of contexts call for it.
Moderation in Jamovi Picture 8
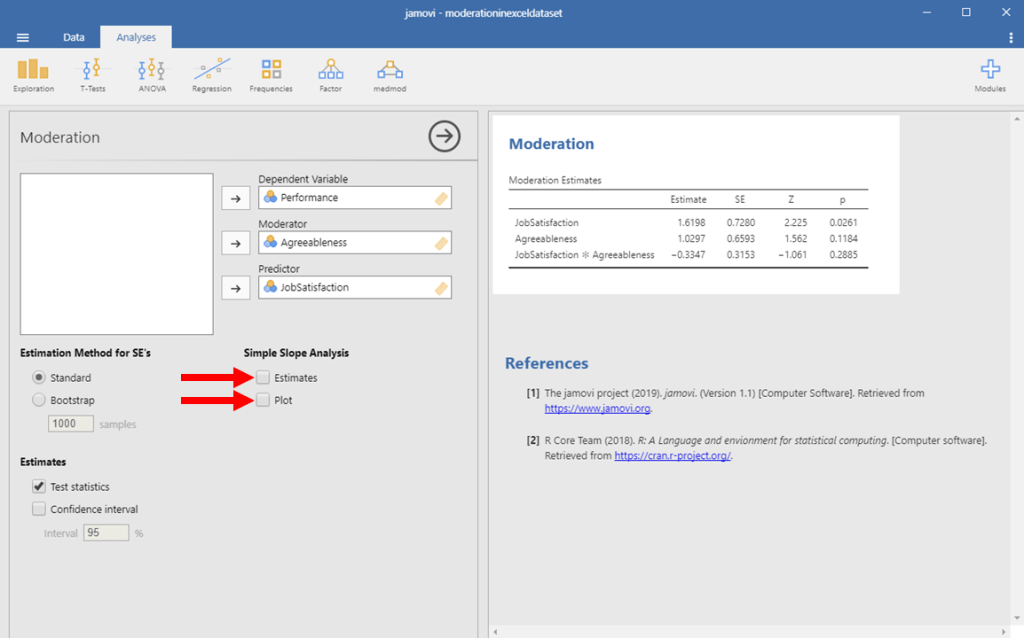
To get this information, click on the two boxes next to Estimates and Plot in the Simple Slopes Analysis section.
Moderation in Jamovi Picture 9
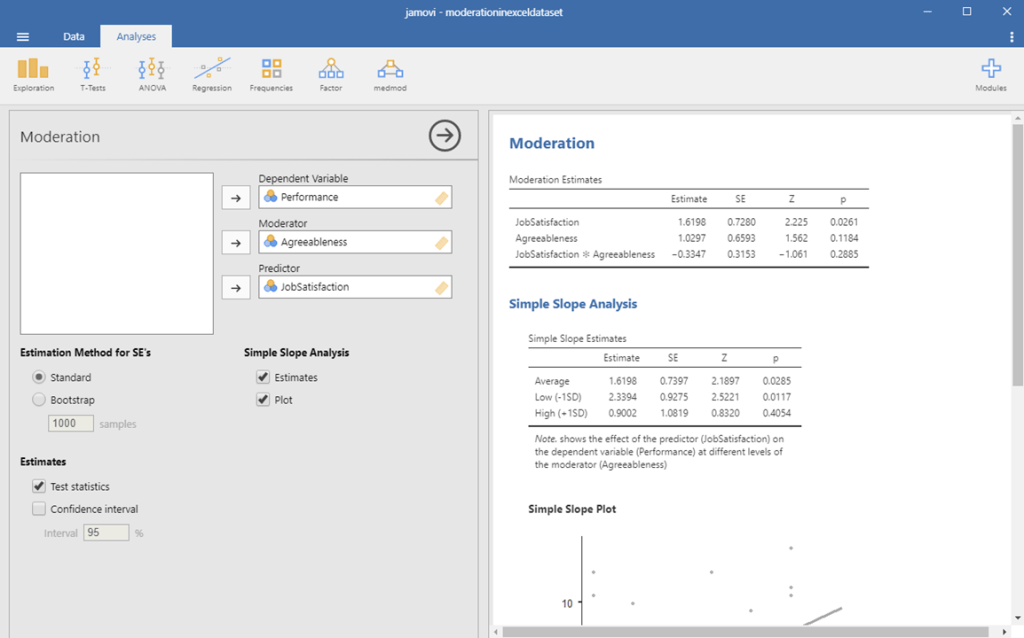
We finally have everything that we need! Check the image below to make sure that your output looks similar. If not, go back and see where your analysis differed from mine.
Moderation in Jamovi Picture 10
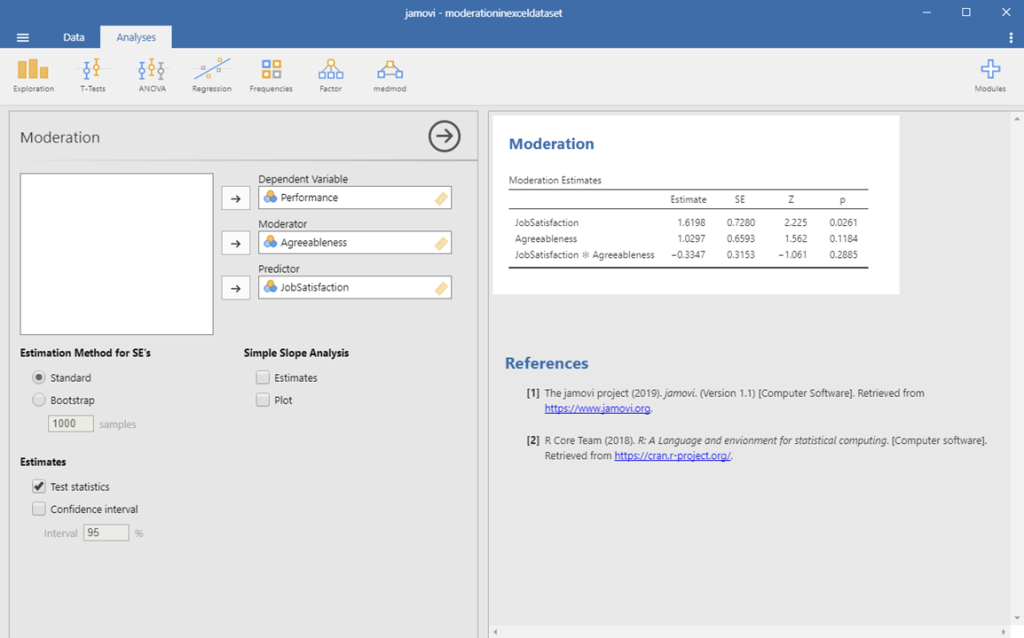
To interpret these results, we first want to look at the interaction line, which tells us whether our moderating effect is statistically significant. This is the line that has our two variables multiplied together. To determine whether our moderating effect is statistically significant, we look at the p-value on this line.
Moderation in Jamovi Picture 11

In this example, we see that our p-value is .29. This is above .05, and therefore our moderating effect was not statistically significant. If our moderating effect was statistically significant, we would only interpret our interaction effect. Because it is not statistically significant, we should look at our direct effects, too.
Moderation in Jamovi Picture 12
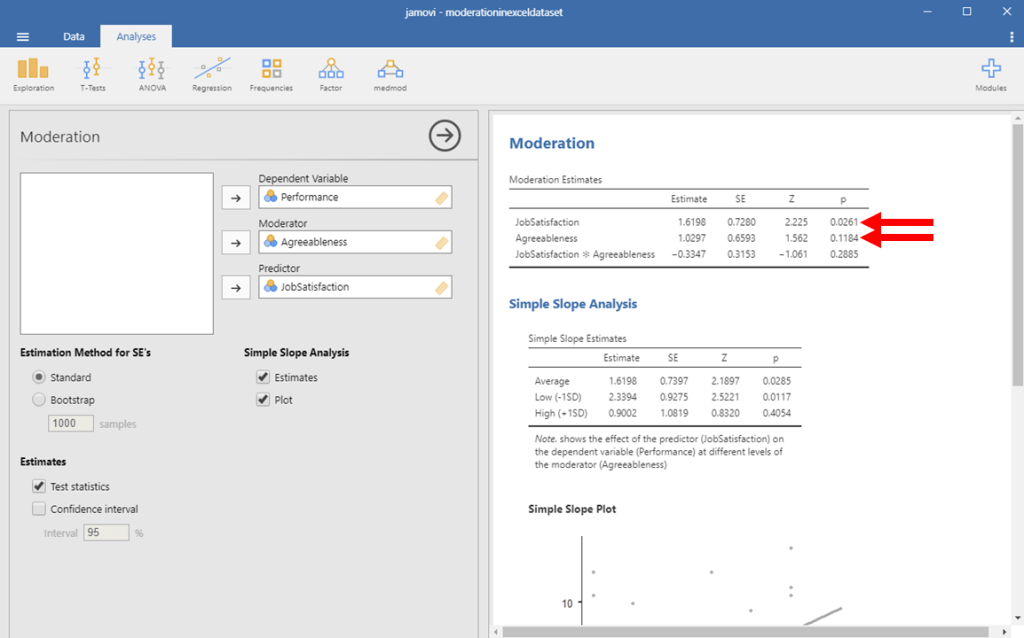
In this example, we see that the direct effect of Job Satisfaction was statistically significant (p = .03), but the effect of agreeableness was not statistically significant (p = .12). We can also see that the beta associated with job satisfaction is positive. So, we can say that job satisfaction is a significant and positive predictor of job performance, whereas agreeableness does not have a significant relation with job performance.
Great work on following this guide. Moderation is much easier to complete in Jamovi than other programs, but it is still a difficult concept. If you have any questions whatsoever, please email me at MHoward@SouthAlabama.edu!
Author Edit: After writing this guide, I tried to go back and replicate the analyses that Jamovi performs in R when using the mod() command, and I can’t quite replicate them perfectly. I can get the same estimates for the interaction term but not the independent variable or moderator. If anyone has an explanation, please let me know! In the syntax below, results should give the same estimates as summary(sem1). I should also note that mod() uses a SEM framework via lavaan, which I previously did not note above.
My syntax is below:
library(medmod)
set.seed(1234)
X <- rnorm(100)
M <- rnorm(100)
X_M <- X*M
Y <- 0.7*X + 0.1*M + 4.2*X_M + rnorm(100)
dat <- data.frame(X=X, M=M, Y=Y)
results <- mod(dat, dep = "Y", pred = "X", mod = "M")

library(dplyr)
library(lavaan)
df <- dat
df <- df %>% mutate_at(vars(X, M), funs(c=scale))
df <- df %>% mutate(X_x_M = X_c * M_c)

moderation_model <- '
  Y ~ b0*1 + b1*X_c + b2*M_c + b3*X_x_M

  M_c ~ M.mean*1

  M_c ~~ M.var*M_c

  SD.below := b1 + b3*(M.mean - sqrt(M.var))
  mean := b1 + b3*(M.mean)
  SD.above := b1 + b3*(M.mean + sqrt(M.var))
  '

sem1 <- sem(model = moderation_model,
            data = df,
            se = "bootstrap",
            bootstrap = 1000)
Hello,
could it be that Jamovi does not do automatic mean centring at all? That would at least explain why only the interaction remains the same when reproducing in R.
Many greetings
LikeLike
Hello,
could it be that Jamovi does not do automatic mean centring at all? That would at least explain why only the interaction remains the same when reproducing in R.
Many greetings
LikeLike