
From learning about the one-way ANOVA, we know that ANOVA is used to identify the mean difference between more than two groups. A one-way ANOVA is used when we have one grouping variable and a continuous outcome. But what should we do if we have two grouping variables? As you’ve probably guessed, we can conduct a two-way ANOVA. Because this situation is fairly common, I created the page below to provide a step-by-step guide to calculating a two-way ANOVA in R. As always, if you have any questions, please email me a MHoward@SouthAlabama.edu!
As mentioned, an ANOVA is used to identify the mean difference between more than two groups, and a two-way ANOVA is used to identify the mean difference between more than two groups when you have a two grouping variables and a continuous outcome. So, a two-factor ANOVA is used to answer questions that are similar to the following:
- What is the mean difference of test grades between left- and right-handed students, students in Dr. Howard’s and Dr. Smith’s classes, and the combinations of these groups?
- What is the mean difference in total output of factories defined by location as well as industry?
- What is the mean difference in performance for four different training programs, each performed at four different locations, and the combination of training program and location.
Now that we know what a two-way ANOVA is used for, we can now calculate a two-way ANOVA in R. To begin, open your data in R. If you don’t have a dataset, download the example dataset here. In the example dataset, we are simply comparing the means two different grouping variables, each with three different groups, on a single continuous outcome. You can imagine that the groups and the outcome are anything that you want.
Also, this dataset is in the .xlsx format, and the current guide requires the file to be in .csv format. For this reason, you must convert this file from .xlsx format to .csv format before you can follow along using this dataset. If you do not know how to do this, please visit my page on converting a file to .csv format. After converting the file, you can continue with this guide.
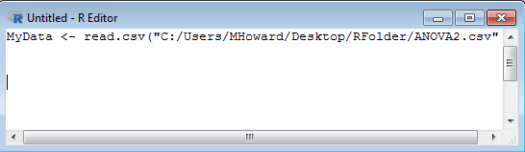
First, you must import your data to R. For the current examples, we are going to label our data as: MyData. For a more in-depth review of opening data in R, please visit my guide on the topic.
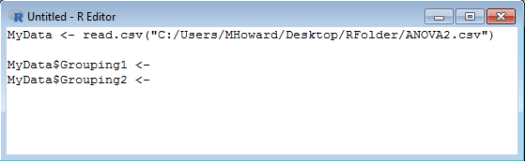
Before conducting our ANOVA, we need to first indicate that our grouping variables within our dataset are indeed grouping variables. To do this, we first refer to our grouping variables in our dataset, which are MyData$Grouping1 and MyData$Grouping2, followed by an arrow, <- . So, we would type MyData$Grouping1 <- as well as MyData$Grouping2 on the next line.
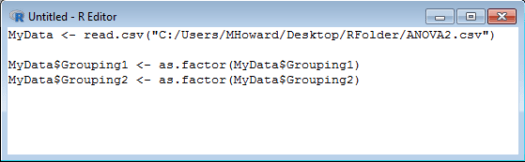
Now, we use the command as.factor() to indicate that our grouping variables are grouping variables. Type: as.factor( . Then, include the reference to the grouping variables followed by a closed bracket.
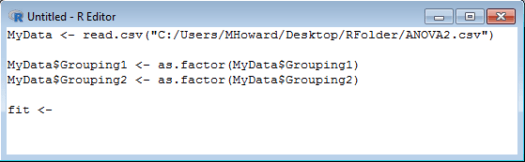
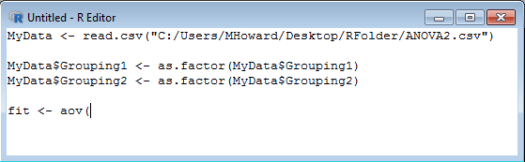
We are going to assign our output to the following term: fit . So, please type: fit <- .
For our analysis, we are going to use the aov() command. Type: aov( .
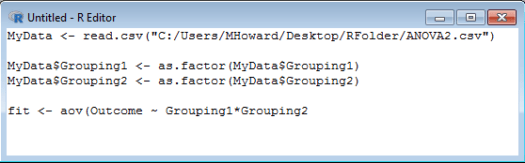
In the aov() command, the first variable that we enter is our outcome variable. For our dataset, out outcome variable is labeled Outcome. We also need to identify that this is our outcome variable within the command by typing a ~. So, we would type: Outcome ~ .

Next, we identify our grouping variables. In the current dataset, our grouping variables are labeled Grouping1 and Grouping2. We should thereby type: Grouping1*Grouping2, .
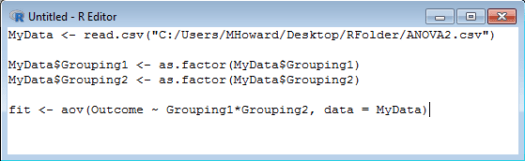
Now, we just need to identify our dataset and close our command. Type: data=MyData).
Because we are assigning our output to “fit,” we need to tell R to provide a summary of fit. On the following line, we should therefore type: summary(fit) .
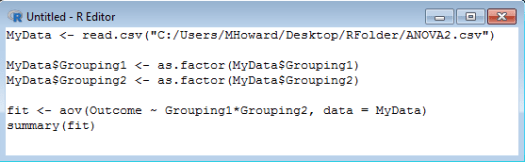
Run your syntax to get your output. . .
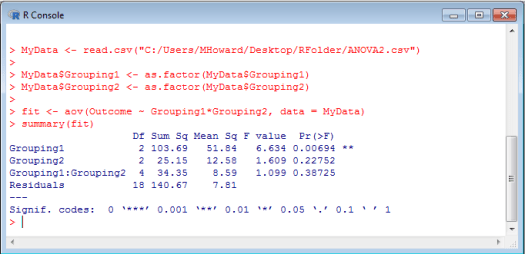
Did you get these results? Great! We can see that the F-value for Grouping 1 is 6.634, the F-value for Grouping 2 is 1.609, and the F-value for the interaction term is 1.099. We can also see that the p-value for Grouping 1 is < .05, whereas the p-values for the other two effects are > .05. So, only the effect of Grouping 1 is statistically significant, and the groups only differ in regards to the Grouping 1 variable. Neat!
At this point, there are a few different things we could do to probe the nature of the group differences. The most effective would likely be to rerun a one-way ANOVA with only the Grouping 1 variable followed by post hoc tests. If we ran post hoc tests on the two-way ANOVA (e.g. TukeyHSD(fit)), we would get 36 different comparisons! That would be a lot to analyze individually, and our interaction term was not significant anyways. So, I would recommend the latter and running a one-way AONVA. If you don’t know how to do this, visit my page on one-way ANOVAs in R.
That’s all for two-way ANOVAs. If you have any questions or comments, please email me at MHoward@SouthAlabama.edu.
