
From learning about the one-way ANOVA, we know that ANOVA is used to identify the mean difference between more than two groups. A one-way ANOVA is used when we have one grouping variable and a continuous outcome. But what should we do if we have two grouping variables? As you’ve probably guessed, we can conduct a two-way ANOVA. Because this situation is fairly common, I created the page below to provide a step-by-step guide to calculating a two-way ANOVA in Jamovi. As always, if you have any questions, please email me a MHoward@SouthAlabama.edu!
As mentioned, an ANOVA is used to identify the mean difference between more than two groups, and a two-way ANOVA is used to identify the mean difference between more than two groups when you have a two grouping variables and a continuous outcome. So, a two-factor ANOVA is used to answer questions that are similar to the following:
- What is the mean difference of test grades between left- and right-handed students, students in Dr. Howard’s and Dr. Smith’s classes, and the combinations of these groups?
- What is the mean difference in total output of factories defined by location as well as industry?
- What is the mean difference in performance for four different training programs, each performed at four different locations, and the combination of training program and location.
Now that we know what a two-way ANOVA is used for, we can now calculate a two-way ANOVA in Jamovi. To begin, open your data in Jamovi. If you don’t have a dataset, download the example dataset here. In the example dataset, we are simply comparing the means two different grouping variables, each with three different groups, on a single continuous outcome. You can imagine that the groups and the outcome are anything that you want.
Also, this file is in .xls format, but Jamovi cannot open this format. To learn how to change this .xls file to a .csv file, which Jamovi can open, please click here. Also, the pictures below are a little small on the page. Click on the link above each picture to view a larger version of the picture in a new window.
The data should look something like this:
Two-Way ANOVA in Jamovi Picture 1
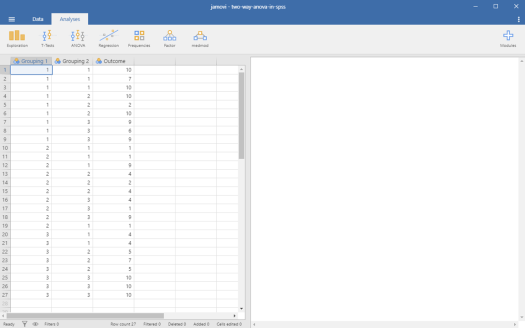
If you data doesn’t look like this, you should probably reformat it to appear similarly. Calculating an ANOVA in Jamovi may be a little difficult with different data formats.
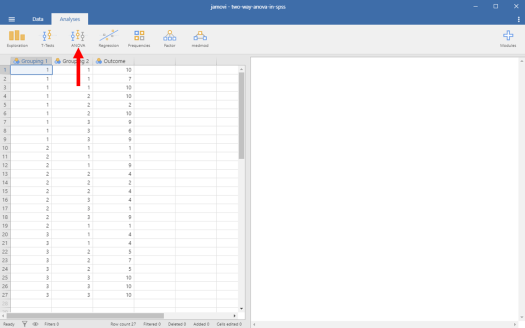
To start, click on the “ANOVA” button at the top.
Two-Way ANOVA in Jamovi Picture 2
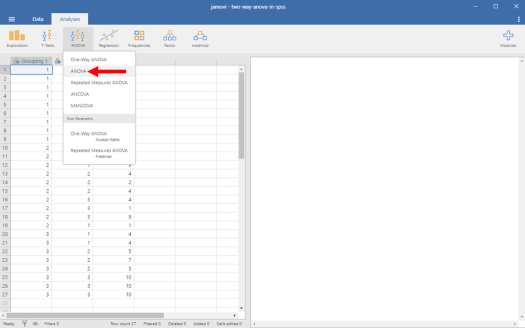
From here, click on “ANOVA”.
Two-Way ANOVA in Jamovi Picture 3
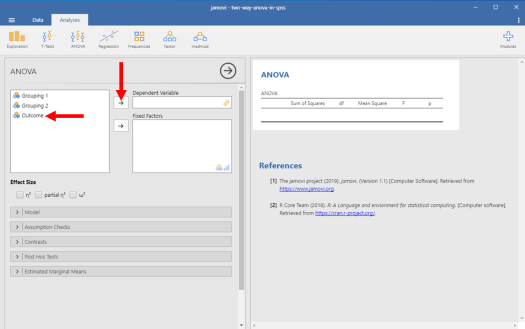
You should then see a window that looks like the following:
Two-Way ANOVA in Jamovi Picture 4
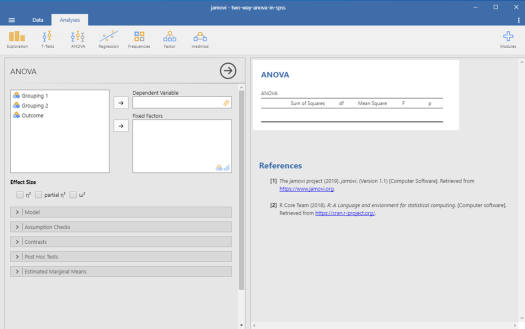
From here, we need to indicate which variable is our outcome in Jamovi. To do so, click on the variable labeled “Outcome”, and then click on the right-facing arrow beside the “Dependent Variable” box.
Two-Way ANOVA in Jamovi Picture 5
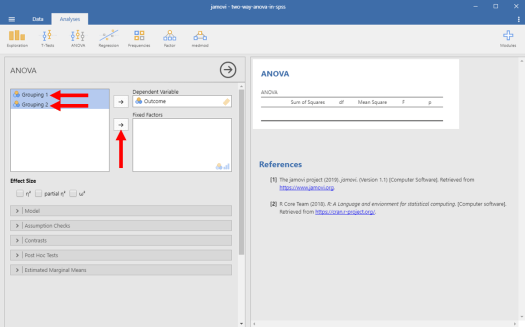
Then, we need to identify our grouping variables in Jamovi. To do so, we need to move the variables labeled “Grouping 1” and “Grouping 2” to the “Fixed Factors” box. You can either move them one at a time or both at the same time. Either way, you highlight these two variables, and then you click the right-facing arrow next to the “Fixed Factors” box.
Two-Way ANOVA in Jamovi Picture 6
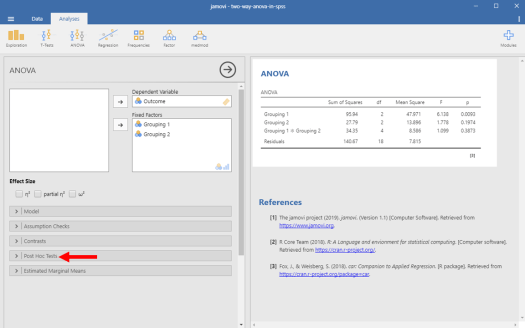
As you will see, Jamovi then automatically calculates your ANOVA results, but we should first ask for one other statistic – post hoc tests. To get these, click on the tab labeled “Post Hoc Tests”.
Two-Way ANOVA in Jamovi Picture 7
Now, the pop open menu seen below should appear.
Two-Way ANOVA in Jamovi Picture 8
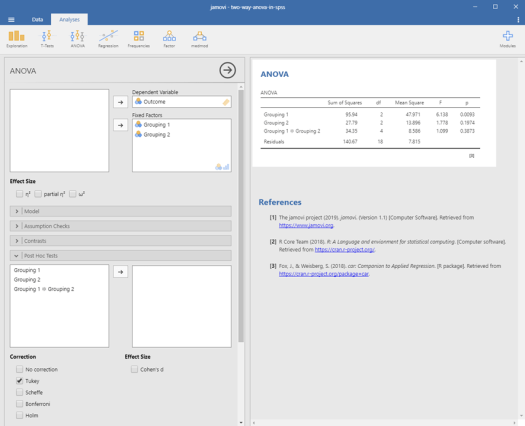
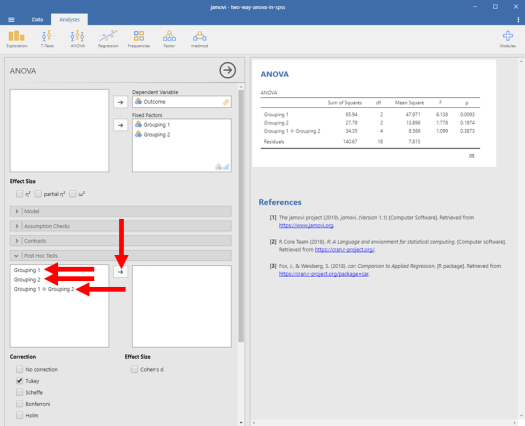
In this new menu, we want to move “Grouping 1”, “Grouping 2”, and “Grouping 1 + Grouping 2” into the other box. Once again, these can be moved one at a time or all together. Either way, we are going to highlight all three, and then click on the right-facing arrow.
Two-Way ANOVA in Jamovi Picture 9
We should get our final results. Let’s go ahead and close that pop open menu first before looking at them too thoroughly, though. Click on the tab labeled “Post Hoc Tests”.
Two-Way ANOVA in Jamovi Picture 10
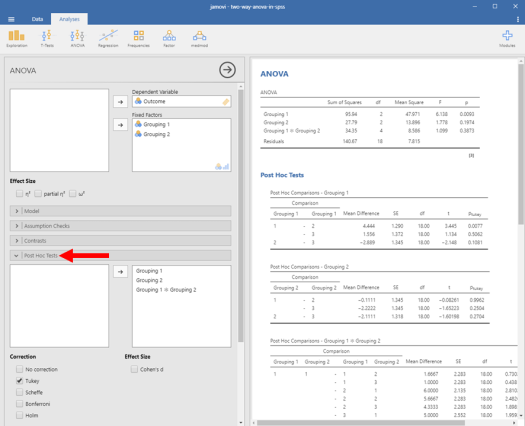
Your final output should look like mine below:
Two-Way ANOVA in Jamovi Picture 11

Now we can finally interpret our results. In the first table, we can see the p-values associated with each grouping variable and the interaction term. Only Grouping 1 had a significant group mean difference (p = .0093), whereas Grouping 2 and the interaction term (Grouping 1 * Grouping 2) were not statistically significant (p > .05). So, we would say that the differences in the means of the first grouping variable were statistically significant. To identify the nature of these differences, however, we would have to analyze our post hoc tests. Because only Grouping 1 had a significant effect, we would only inspect the post hoc tests for Grouping 1.
The post hoc tests associated with the Grouping 1 variable are included in the second table. The first row with numbers represents the difference between Group 1 and Group 2 of the Grouping 1 variable. As we can see, the p-value associated with this comparison is statistically significant (p = .0077). Either of the other two group comparisons are statistically significant (Group 1 and 3, Group 2 and 3). So, based on these post hoc tests, we would say that the significant effect of Grouping 1 was driven by the difference between Group 1 and Group 2.
That’s all for the two-way ANOVA in Jamovi. As always, if you have any questions, please email me a MHoward@SouthAlabama.edu!
