
I often use two-sample t-tests as an introduction to Python in my statistics courses. Because the students are still getting used to functions in Python, they tend to have many difficulties with this lesson. For this reason, I created the page below to provide an easy-to-read guide on performing two-sample t-tests in Python. As always, if you have any questions, please email me a MHoward@SouthAlabama.edu!
Before learning about two-sample t-tests in Python, we must first know what a two-sample t-test is used for. The textbook definition says that a two-sample t-test is used to “determine whether two sets of data are significantly different from each other”; however, I am not a fan of this definition. Instead, I prefer to say that a two-sample t-test is used to “test whether the means of a measured variable in two groups is significantly different.” So, a two-sample t-test is used to answer questions that are similar to the following:
- In our sample, do women have better test grades than men?
- Are men taller than women?
- Do people in a class taught by Dr. Howard perform better on a test than those in Dr. Smith’s class?
- Do employees in Training Group A have better performance than Training Group B?
Now that we know what a two-sample t-test is used for, we can now calculate a two-sample t-test in Python! To begin, open your data in Python. If you don’t have a dataset, download the example dataset here. In the example dataset, we are comparing the test grades of two classes (Dr. Howard and Dr. Smith) to determine which class has higher grades on an exam.
Also, this dataset is in the .xlsx format, and the current guide requires the file to be in .csv format. For this reason, you must convert this file from .xlsx format to .csv format before you can follow along using this dataset. If you do not know how to do this, please visit my page on converting a file to .csv format. While this page was written for R, you can follow the initial steps to convert .xlsx to .csv by using Excel alone. After converting the file, you can continue with this guide.
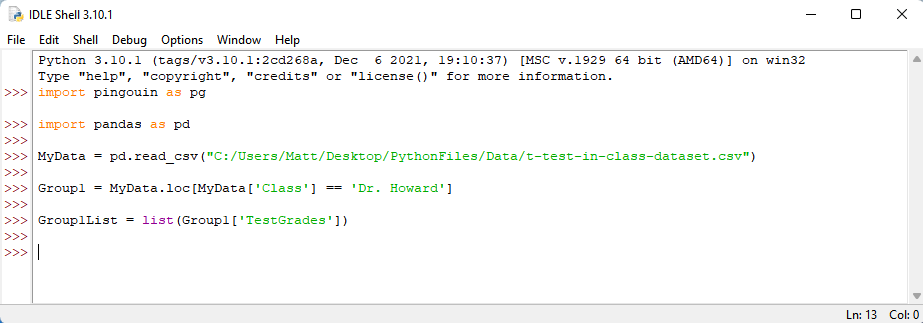
We are going to be using the pingouin and pandas modules. If you don’t know how to install modules, you can look at my guide for installing Python modules here. Likewise, you need to open your .csv file with Python. If you don’t know how to do so, you can look at my guide for opening .csv files in Python. In the current example, I named my dataset: MyData . Your initial code should look like the following:

In our example dataset, we have one column that indicates the group of which each participant was a member and their test score. In Python, we need to create two lists: one list for the test grades of Dr. Howard’s course and one list for the test grades of Dr. Smith’s course. We can then compare the means of the two lists by conducting a two-sample t-test.
To create the first list, we should create a variable named Group1 by typing: Group 1 = . Then, to get the data of only Dr. Howard’s course, we should type: MyData.loc[MyData[‘Class’] == ‘Dr. Howard’] . Press enter.

Group1 is now a reduced dataset of only Dr. Howard’s students. To make a list of only Dr. Howard’s test grades, let’s first name it by typing: Group1List = . Then, to make Group1List a list of only Dr. Howard’s test grades, type the following: list(Group1[‘TestGrades’]) . Press enter.
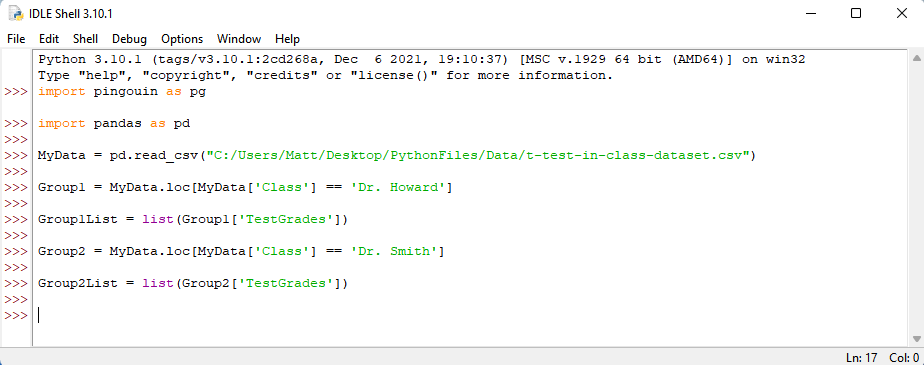
Now let’s do the same for Dr. Smith’s test grades. Type: Group2 = MyData.loc[MyData[‘Class’] == ‘Dr. Smith’] . Press enter.

Then create the list by typing: Group2List = list(Group2[‘TestGrades’]) . Press Enter.
Lastly, we want to run our two-sample t-test command. We want to have our output rounded to two decimal places, or else the output will now show all the columns. So, we begin by typing: round( . This is followed by the t-test command which is done by typing: pg.ttest( . We want to identify our two lists for the analyses by typing: Group1List, Group2List), . Finally, we enter the number of decimal places to round it to as well as close our parenthesis by typing: 2) . Press enter.

Did you get something like the output above? From this output, we can see that the p-value is less than .05. So, our results are statistically significant. Neat!
To know which group was significantly larger, you can calculate the means of Group1List and Group2List. Because we know that they are significantly different, the larger one is therefore significantly larger.
Do you still have any questions? Or comments about this guide? Feel free to email me at MHoward@SouthAlabama.edu. I am always happy to chat!
