
T-tests are used to identify the mean difference between two groups. But what do you do if you want to compare the mean difference of more than two groups? Well, as you’ve probably guessed, you can perform an ANOVA. Because ANOVA is a commonly-used statistical tool, I created the page below to provide a step-by-step guide to calculating an ANOVA in Jamovi. This page is for a one-way ANOVA, which is when you have a single grouping variable and a continuous outcome. As always, if you have any questions, please email me a MHoward@SouthAlabama.edu!
As mentioned, an ANOVA is used to identify the mean difference between more than two groups, and a one-way ANOVA is used to identify the mean difference between more than two groups when you have a single grouping variable and a continuous outcome. So, a one-way ANOVA is used to answer questions that are similar to the following:
- What is the mean difference of test grades between Dr. Howard’s class, Dr. Smith’s class, and Dr. Kim’s class?
- What is the mean difference in total output of five different factories?
- What is the mean difference in performance of four different training groups?
Now that we know what an one-way ANOVA is used for, we can now calculate an one-way ANOVA in Jamovi. To begin, open your data in Jamovi. If you don’t have a dataset, download the example dataset here. In the example dataset, we are simply comparing the means of three different groups on a single continuous outcome. You can imagine that the groups and the outcome are anything that you want.
Also, this file is in .xls format, but Jamovi cannot open this format. To learn how to change this .xls file to a .csv file, which Jamovi can open, please click here. Also, the pictures below are a little small on the page. Click on the link above each picture to view a larger version of the picture in a new window.
The data should look something like this:
One-Way ANOVA in Jamovi Picture 1
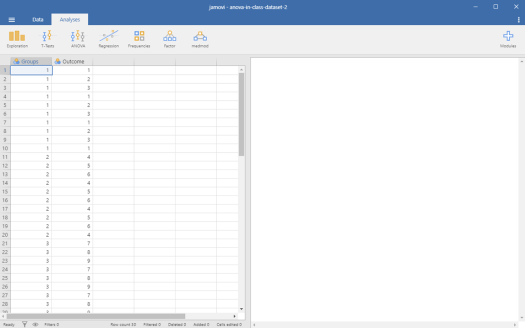
If your data doesn’t look like this, you should probably reformat it to appear similarly. Calculating an ANOVA in Jamovi may be a little difficult with different data formats.
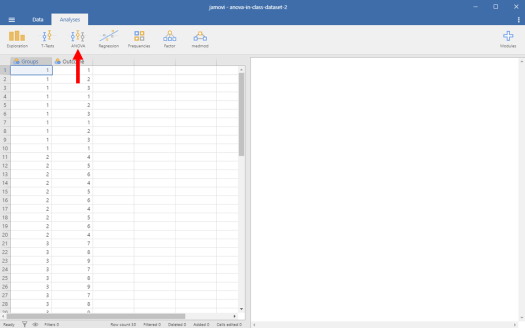
To start, click on the “ANOVA” button at the top.
One-Way ANOVA in Jamovi Picture 2
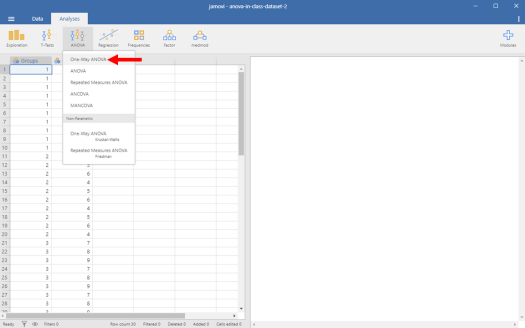
Then click on “One-Way ANOVA”.
One-Way ANOVA in Jamovi Picture 3
You should see a new window that looks like the one below:
One-Way ANOVA in Jamovi Picture 4
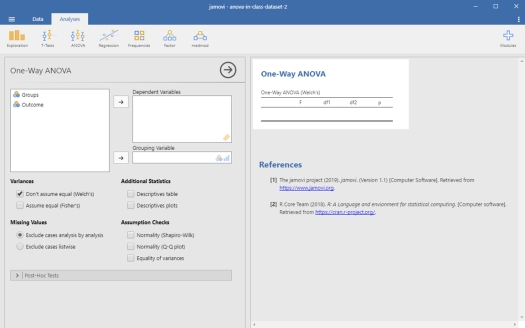
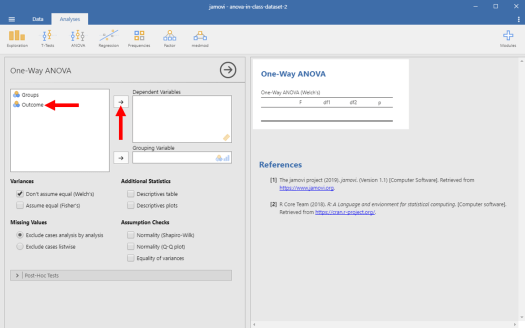
From here, we want to identify our outcome variable in Jamovi. To do this, click on the variable labeled “Outcome” and then click on the right-facing arrow next to the “Dependent Variables” box.
One-Way ANOVA in Jamovi Picture 5
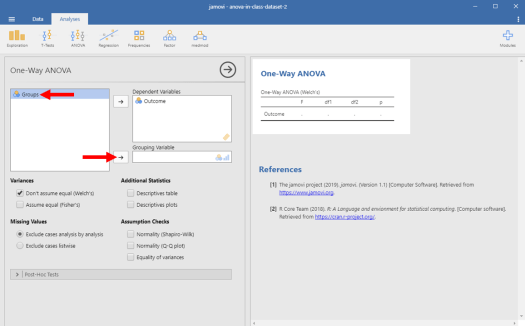
Then, we want to identify our grouping variable in Jamovi. To do this, click on the variable labeled “Groups” and then click on the right-facing arrow next to the “Grouping Variable” box.
One-Way ANOVA in Jamovi Picture 6
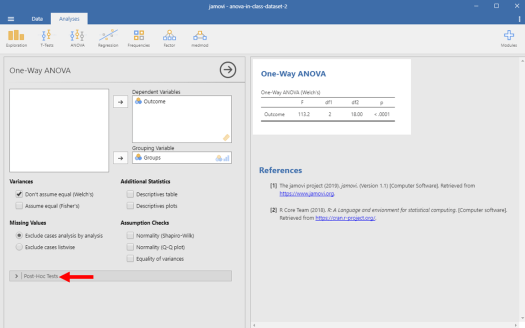
As you will see, Jamovi will automatically calculate our ANOVA results for us. Before we look at them, we should obtain another statistic – post hoc tests. To get these, fist click on the tab labeled “Post-Hoc Tests”.
One-Way ANOVA in Jamovi Picture 7
A new window should pop open, as seen below:
One-Way ANOVA in Jamovi Picture 8
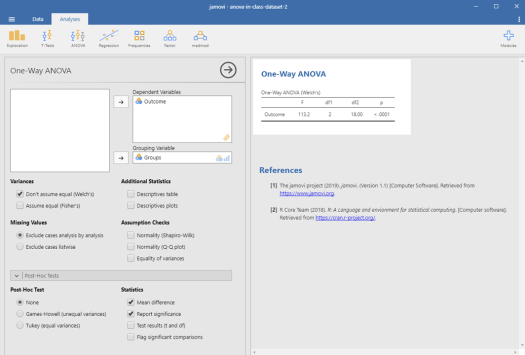
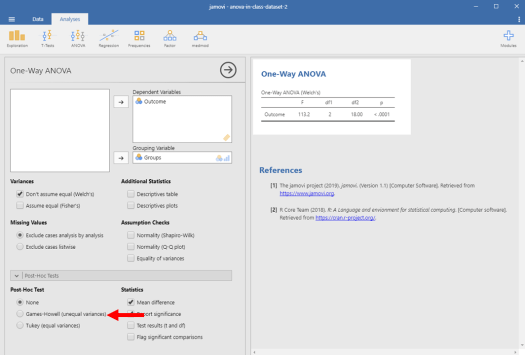
In this pop open window, you should click on the button next to “Games-Howell (unequal variances).
One-Way ANOVA in Jamovi Picture 9
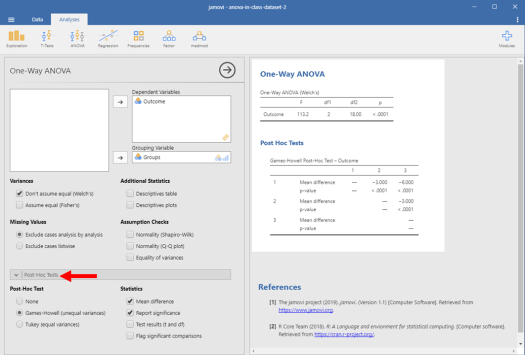
Lastly, let’s go ahead and close this pop open window. Click on the tab labeled “Post-Hoc Tests”.
One-Way ANOVA in Jamovi Picture 10
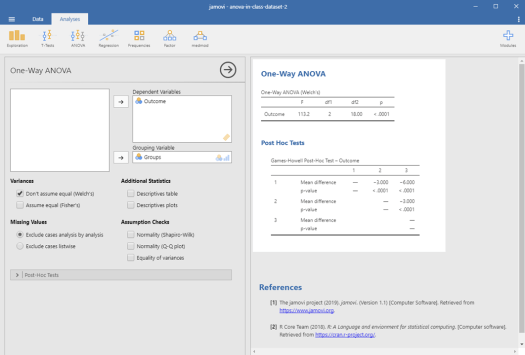
Now, you should have your final output, which should look like mine below:
One-Way ANOVA in Jamovi Picture 11
Did you get the same output? If so, great! If not, go back and see where your analyses differed from mine.
In this output, we should first look at the top table. As we can see in the p-value column, the overall p-value associated with the ANOVA test was < .0001. This is much smaller than .05, indicating that there is a significant difference among our groups. But in what manner?
To answer this question, we should look at the second table. To read this table, we see where the group row intersects with the group column. So, we can see that Group 1 and Group 2 had a mean difference of -3 and a p-value of < .0001. This means that their means were -3 apart (with Group 2 having the greater mean), and this difference was statistically significant. We can also see that Groups 1 and 3 had a mean difference of -6 and a p-value of < .0001 (with Group 3 having the greater mean), and Groups 2 and 3 had a mean difference of -3 and a p-value of < .0001 (with Group 3 having the greater mean). So, our overall ANOVA was statistically significant, and each of our group comparisons were statistically significant.
That’s all for performing an ANOVA in Jamovi. As always, if you have any questions or comments, please email me at MHoward@SouthAlabama.edu.
