
The need to conduct a one-sample t-test is much less frequent than the need to conduct a two-sample t-test. For that reason, it is easy to forget how to perform a one-sample t-test. Fortunately, I have created a guide for performing a one-sample t-test in Python. As always, if you have any questions, please email me a MHoward@SouthAlabama.edu!
Before learning how to conduct a one-sample t-test in Python, let’s briefly chat about their purpose. In general, a one-sample t-test is used to identify whether the mean value of a group is significantly different from a specified value (that you select). So, it may be used to answer research questions similar to the following:
- Is a class’s average grade significantly different than a value of 80?
- Is a group’s average height significantly different than 5’6″?
- Is a company’s yearly revenue significantly different than 10 million dollars?
These types of questions may be interesting, but they are honestly not all that common in research or practice. Often, selection an arbitrary value to test isn’t all that informative. However, I can think of a few examples in which a one-sample t-test may be useful:
- When you know a pre-defined value is important.
- When you have a certain expected value for a sample.
- When there is some common-sense value.
- When you are performing a replication study.
Of course, there are other situations in which a one-sample t-test may be useful, so keep your eyes our for these scenarios!
Now that we know what a one-sample t-test is used for, we can now calculate a one-sample t-test in Python! To begin, open your data in Python. If you don’t have a dataset, download the example dataset here. In the example dataset, we have four variables named Var1, Var2, Var3, and Var4. Be aware, however, that this dataset is in the .xlsx format, and the current guide requires the file to be in .csv format. For this reason, you must convert this file from .xlsx format to .csv format before you can follow along using this dataset. If you do not know how to do this, please visit my page on converting a file to .csv format. While this was written for R, the steps for conversion can be completed with Excel alone. After converting the file, you can continue with this guide.
We are going to be using the scipy.stats and pandas modules. If you don’t know how to install modules, you can look at my guide for installing Python modules here. Likewise, you need to open your .csv file with Python. If you don’t know how to do so, you can look at my guide for opening .csv files in Python. In the current example, I named my dataset: MyData . Your initial code should look like the following:

The syntax to conduct a one-sample t-test is now very straightforward. We want to specify our command by typing: stats.ttest_lsamp( . We then want to specify which variable that we want to test. In this case, it is Var1 of the example dataset, which can be targeted by typing: a=MyData[‘Var1’], . Lastly, we want to identify the value to which we want to compare the variable mean. In the current example, the value will be 25. So, we type: popmean=25) . Once you have all that, press enter.
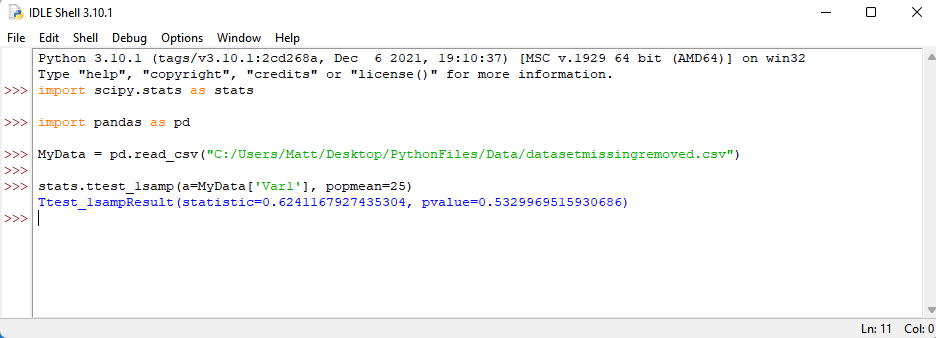
Did you get something like the output above? As we can see, the p-value is above .05, so our results are not statistically significant. If you want, go through and test the other variables against values of 5 (Var2), 3 (Var3), and 4 (Var4). If you have any questions or comments, please email me a MHoward@SouthAlabama.edu. That is all for one-sample t-tests! Thanks for reading!
