
Typically, I tell students that the two primary categories of “basic” statistics is whether they (a) determine the relationship between things or (b) the differences between groups. Sometimes, however, you want to do both. To do this, dummy-coded regression can help out. This page is a brief lesson on how to perform a dummy-coded regression in SPSS. As always, if you have any questions, please email me at MHoward@SouthAlabama.edu!
The typical type of regression is a linear regression, which identifies a linear relationship between predictor(s) and an outcome. Believe it or not, a linear regression can also identify the differences between groups pretty well – as long as we know how to code our predictors correctly. This is where dummy coding can come into play, which can be used to answer the following questions and similar others:
- What is the relationship of people’s training groups on their job performance while accounting for their job satisfaction?
- What is the relationship of people’s county of residence on their life satisfaction while accounting for their income?
- What is the relationship of a widget’s manufacturing process on its assessed quality while accounting for the machine operator’s tenure?
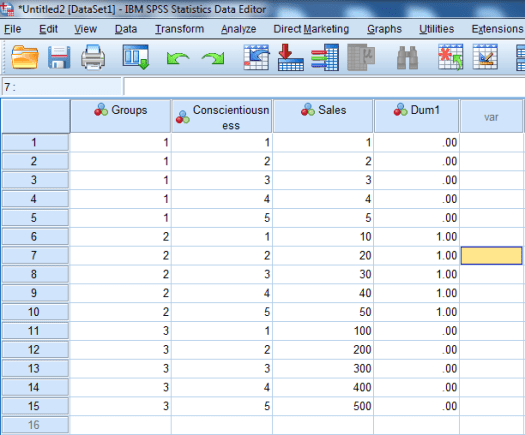
Of course, there is more nuance to dummy-coded regression, but we will keep it simple. To answer these questions, we can use SPSS to calculate a regression equation. If you don’t have a dataset, you can download the example dataset here. In the dataset, we are investigating the relationships of three training groups and conscientiousness with sales.
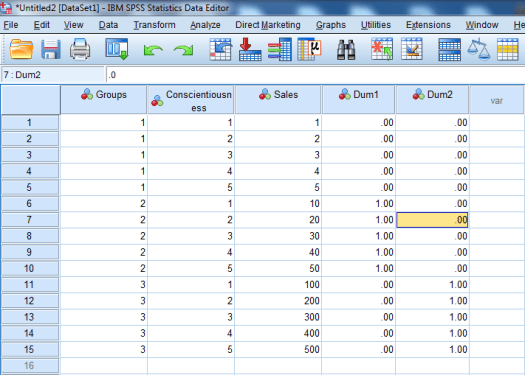
The data should look something like this:

If your dataset looks differently, you should try to reformat it to resemble the picture above. The instructions below may be a little confusing if your data looks a little different.
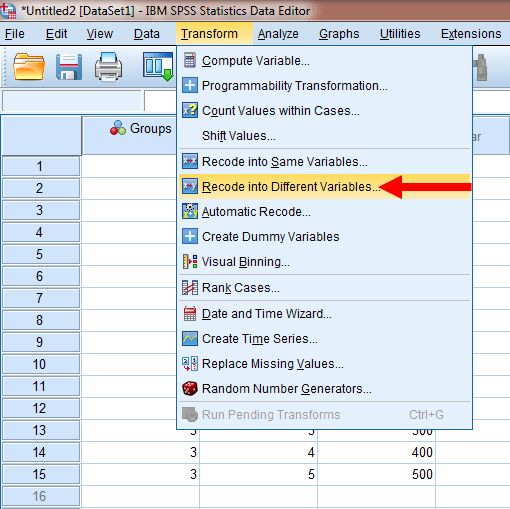
To perform a dummy-coded regression, we first need to create a new variable for the number of groups we have minus one. In this case, we will make a total of two new variables (3 groups – 1 = 2). To do so in SPSS, we should first click on Transform and then Recode into Different Variables.
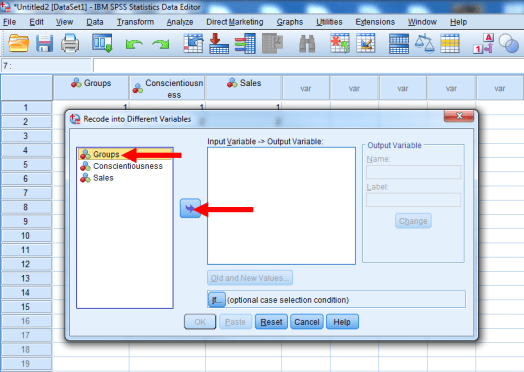
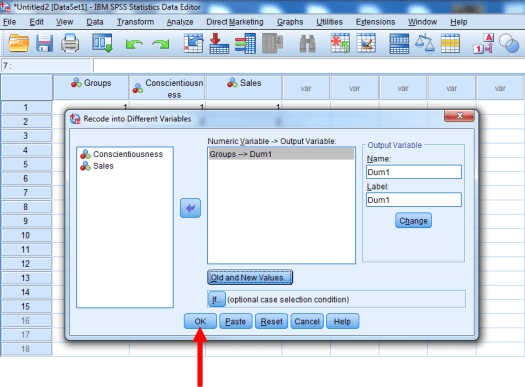
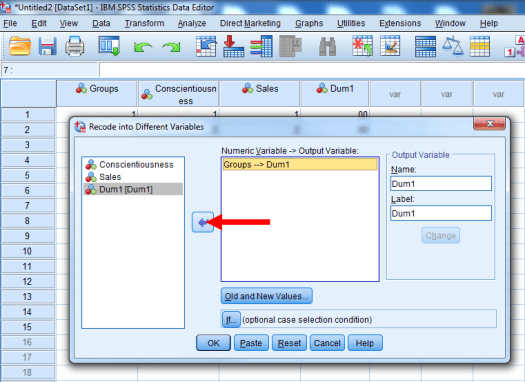
Now, click on Groups, and then click on the highlighted arrow to move Groups to the empty window.
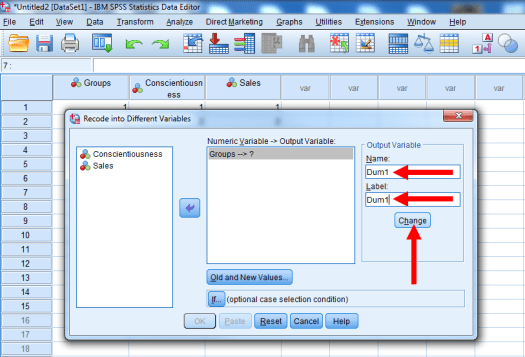
Now, change the Name and the Label to Dum1, and click on Change.
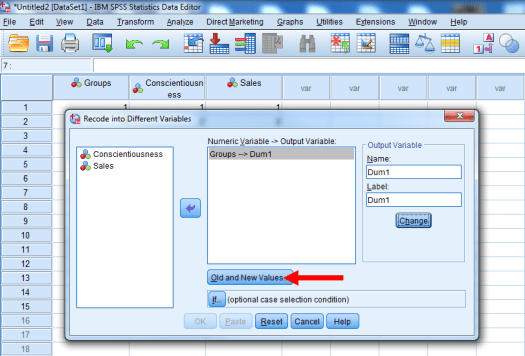
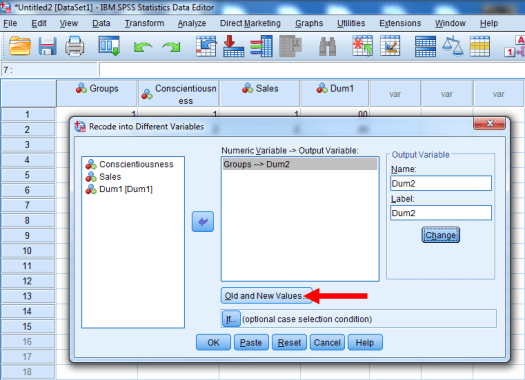
Click on Old and New Values.
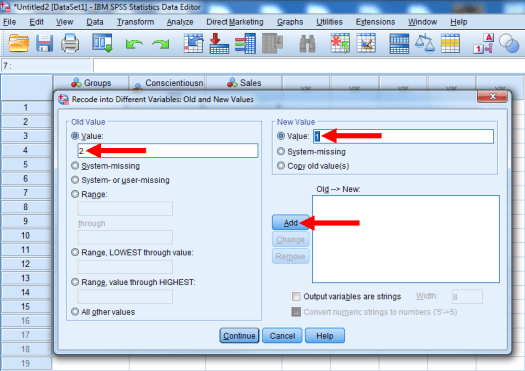
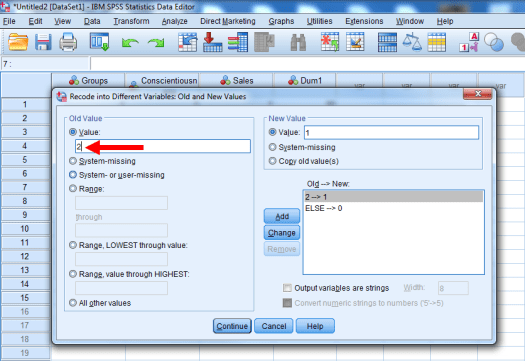
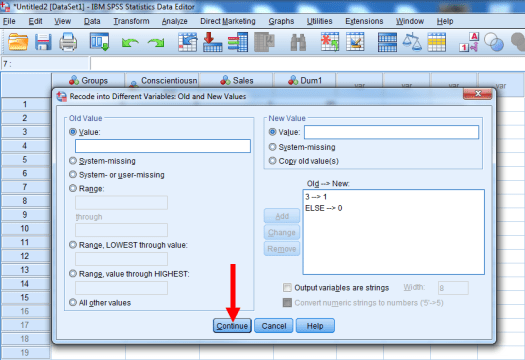
And we’re going to want those in Group 2 to have a value of 1. So, in the Old Value side, enter 2 for the value. Then, in the New Value side, enter 1 for the value. Press Add.
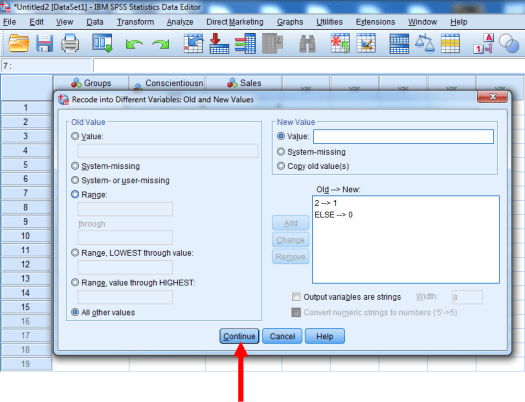
Now, we want everyone else to have a value of 0. So, click on All Other Values in the Old Value side. Then enter 0 for the value in the New Value side. Press Add.

Now press Continue.
And now press OK.
We should have our first dummy-coded variable. Yay!
To create the second, we repeat the process again. Click on Transform and then Recode into Different Variables.

Remove that we had before by clicking on it, and then clicking the highlighted arrow.
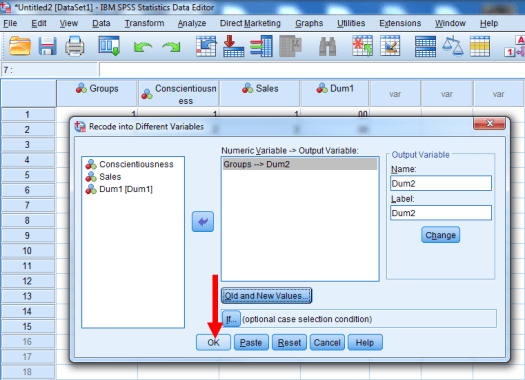
Re-add groups to the window on the right-hand side.

Put Dum2 as the Name and Label. Click Change.

Click on Old and New Values
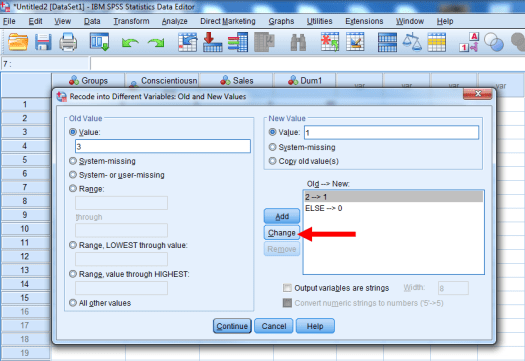
Now, we can just highlight 2 -> 1, and then change the previous 2 to a 3.
Then press Change.
Then press Continue.
And now OK.
We should have two dummy-coded variables. Yay!
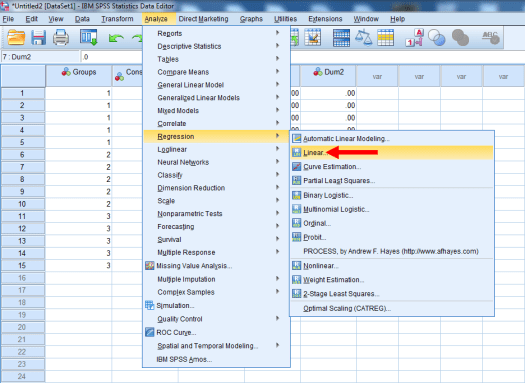
We are now going to perform a regression as usual. Go to Analyze, Regression, and then Linear.
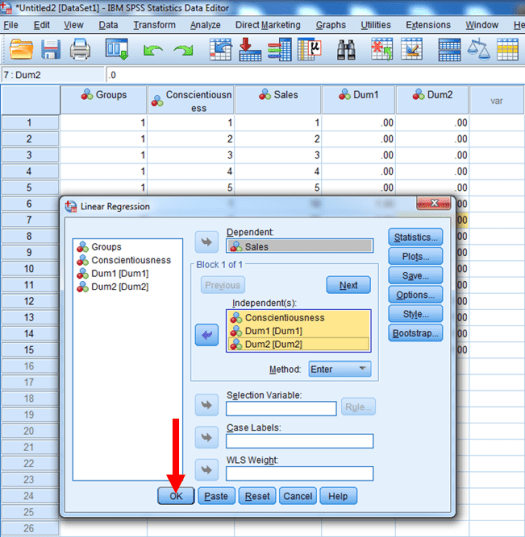
Add sales as your dependent variable.

Then conscientiousness and your dummy-coded variables as your independent variables.

And press OK.
We have results. Yay!

If you need help reading this table, take a look at my Regression in SPSS guide. Otherwise, we can clearly see that the unstandardized beta for Dummy Code 1 is 27; the unstandardized beta for Dummy Code 2 is 297, and the unstandardized beta for conscientiousness is 37. Dummy Code 1 is not statistically significant (p > .05), suggesting that there was not a significant difference between Groups 1 and 2. Dummy Code 2 was statistically significant (p < .001), suggesting that there was a significant difference between Groups 1 and 3. The effect of conscientiousness was significant (p < .05), suggesting that this predictor had a significant influence on sales. Lastly, the overall R-Square is .84, which is very high for the social sciences!
Of course, the results provide other information, which may be useful for your certain purposes, but the current guide just covers the basics.
Also, it should be noted that you can perform other types of coding to compare groups via regression, such as effects-coding. So, if you see someone use coding numbers other than 0 and 1, do not assume that they are wrong!
Now you should be able to perform a dummy-coded regression in SPSS. As always, if you have any questions or comments, please email me a MHoward@SouthAlabama.edu!
