
Many student’s first exposure to inferential statistics is the correlation. Because these students are getting used to statistics in general, correlations can be hard to understand. This page is a brief lesson on how to calculate a set of correlations in Jamovi. As always, if you have any questions, please email me at MHoward@SouthAlabama.edu!
Correlations identify a linear relationship between two variables. In other words, correlations can tell you the relatedness of two things, and correlations can be used to answer the following questions and similar others:
- What is the relationship between job satisfaction and job performance?
- What is the relationship between hours studied and test grades?
- What is the relationship between size of university and number of basketball team wins?
Of course there is more nuance to correlations, but we will keep it simple for this post. Anyways, to answer these types of questions, we can use Jamovi to calculate correlation coefficients. If you don’t have a dataset, you can download the example dataset here. In the dataset, we are investigating the relationships job satisfaction, self-efficacy, and job performance.
The dataset above is a .xlsx file, which Jamovi can open. If you are using a different file format, you may need to convert it to .csv. If you don’t know how to do this, click on the relevant guide here.
Also, the pictures below are a little small on the page. Click on the link above each picture to view a larger version of the picture in a new window.
The data should look something like this:
Correlations in Jamovi Picture 1

If your dataset looks differently, you should try to reformat it to resemble the picture above. The instructions below may be a little confusing if your data looks a little different.
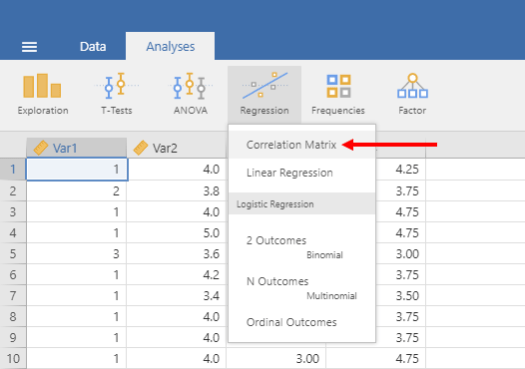
Once you have the data open, the first step is to click on the Regression button and then click on Correlation Matrix, as seen below. Regressions and correlations are entirely different statistics, but we’ll ignore that for now.
Correlations in Jamovi Picture 2
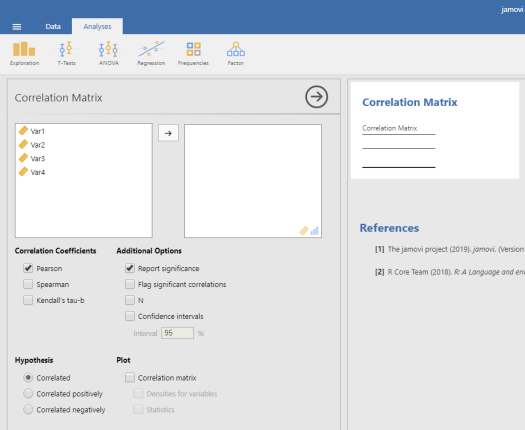
Now your screen should look something like this:
Correlations in Jamovi Picture 3
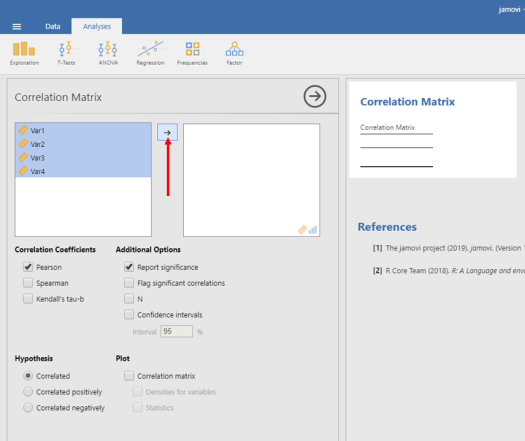
Let’s calculate a correlation matrix with all four variables. To do this, just click on the first one, hold down shift, and then click on the last one. Then, click the arrow pointing right between the two white boxes.
Correlations in Jamovi Picture 4
Woah! You should get instant results. Neat, huh!
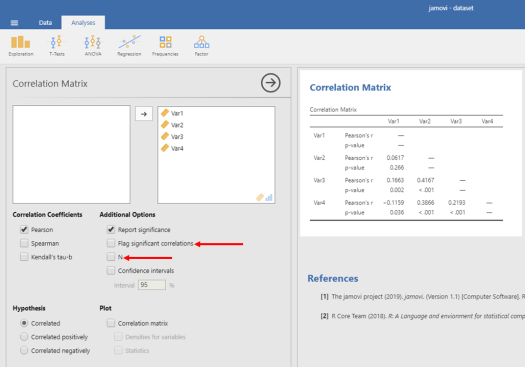
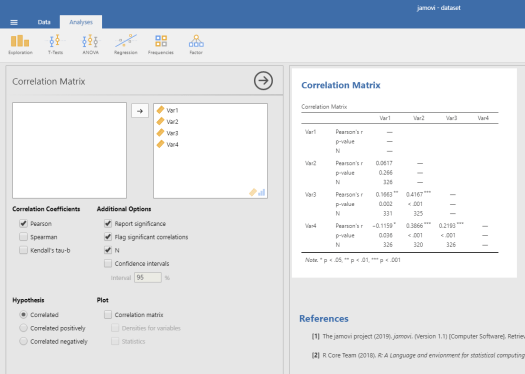
Many people using Jamovi will want output similar to SPSS. To get this in a correlation matrix, you’ll need to click on the box beside “Flag Significant Correlations” and “N”.
Correlations in Jamovi Picture 5
And once you do that, you should get results like those below:
Correlations in Jamovi Picture 6
And there we go! Almost identical to SPSS but for free!
To read the table, pay close attention to where the column meets the row. The number where the Var1 row and the Var2 column intersect is .0617. This means that there is a .06 correlation between Var1 and Var2. Neat!
Correlations in Jamovi Picture 7
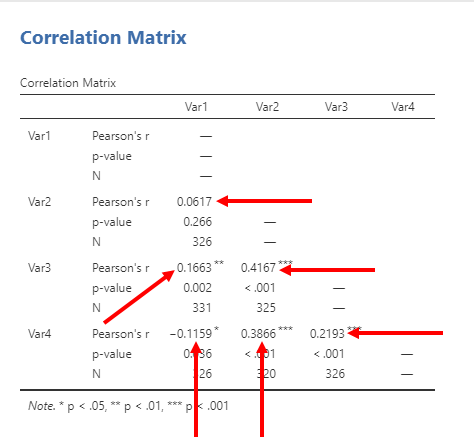
So, from these results, we can determine that…
- Var1 and Var2 have a correlation of .06.
- Var1 and Var3 have a correlation of .17.
- Var1 and Var4 have a correlation of -.12.
- Var2 and Var3 have a correlation of .42.
- Var2 and Var4 have a correlation of .39.
- Var3 and Var4 have a correlation of .22.
But, how can we tell whether these are statically significant? We just look at the Sig. rows.
Correlations in Jamovi Picture 8

From this, we can see that the p-value of the relation between Var1 and Var2 is much larger than .05, and therefore it is not statistically significant. We can also tell that. . .
- The relation of Var1 and Var2 is not statistically significant.
- The relation of Var1 and Var3 is statistically significant.
- The relation of Var1 and Var4 is statistically significant.
- The relation of Var2 and Var3 is statistically significant.
- The relation of Var2 and Var4 is statistically significant.
- The relation of Var3 and Var4 is statistically significant.
So, almost everything was statistically significant. Neat!
Now you should be able to perform a correlation in Jamovi. As always, if you have any questions or comments, please email me a MHoward@SouthAlabama.edu!
