
Sometimes we are interested in determining whether the number of people in specified groups significantly differs. In these cases, it would be most appropriate to apply the chi-square statistical test. The current page provides a step-by-step guide in calculating a chi-square test in Jamovi. As always, if you have any questions, please email me a MHoward@SouthAlabama.edu!
A chi-square test is used to determine whether the number of people in specified groups significantly differs. So, a chi-square test could be used to answer questions that are similar to the following:
- Does the number of males and females differ in Dr. Howard’s class?
- Does the number of people significantly differ in geographic regions?
- Does the number of people differ in four training groups, the four factories that they each were applied at, and the combination of training program and location?
Now that we know what a chi-square test is used for, we can now calculate a chi-square test in Jamovi. To begin, open your data in Jamovi. If you don’t have a dataset, download the example dataset here. In the example dataset, we are simply comparing the number of people in two different grouping variables, each with three different groups. You can imagine that the groups are anything that you want.
This file is in .xls format, but Jamovi cannot open this format. To learn how to change this .xls file to a .csv file, which Jamovi can open, please click here. Also, the pictures below are a little small on the page. Click on the link above each picture to view a larger version of the picture in a new window.
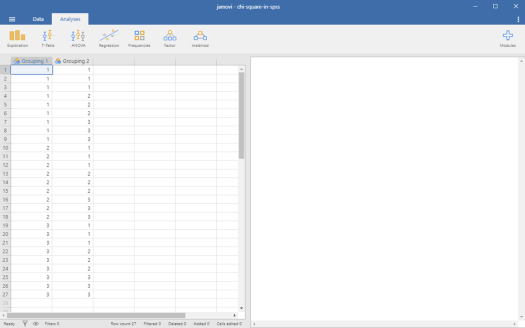
The data should look something like this:
Chi-Square in Jamovi Picture 1
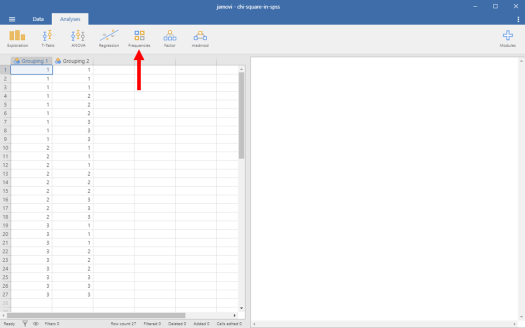
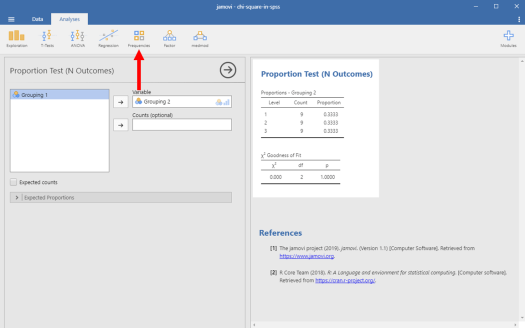
To start, click on the “Frequencies” button at the top.
Chi-Square in Jamovi Picture 2
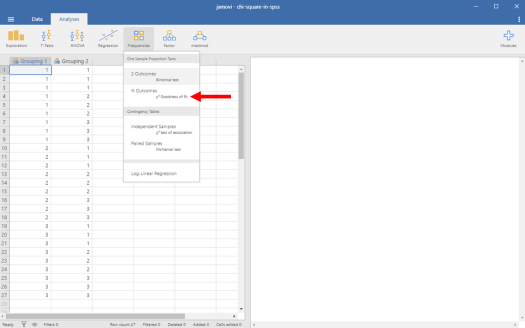
Then click on “N Outcomes chi-square Goodness of fit”.
Chi-Square in Jamovi Picture 3
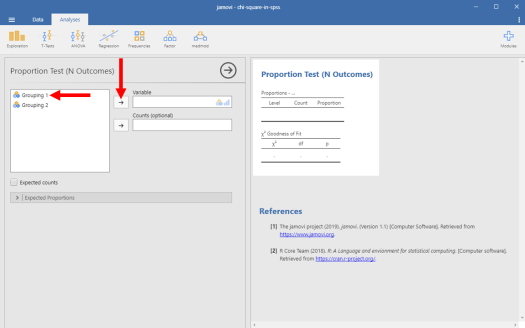
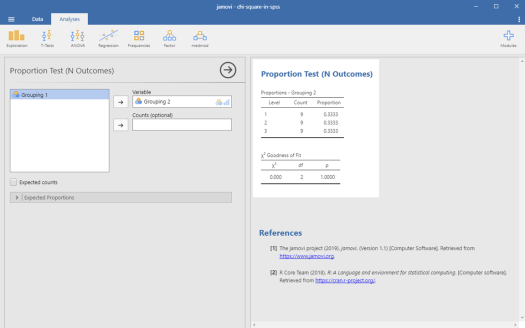
The following window should appear:
Chi-Square in Jamovi Picture 4
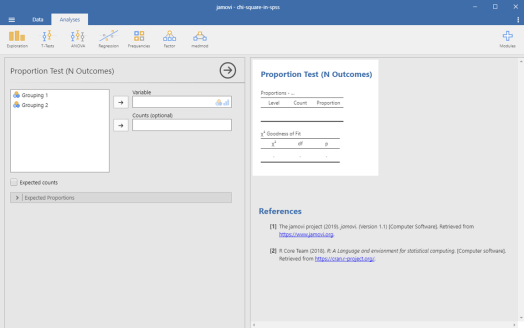
Now, let’s look at the variables one at a time, starting with Grouping 1. Click on Grouping 1, and then click on the right-facing arrow next to the “Variable” box.
Chi-Square in Jamovi Picture 5
And then Jamovi should automatically calculate results for Grouping 1, as seen below:
Chi-Square in Jamovi Picture 6
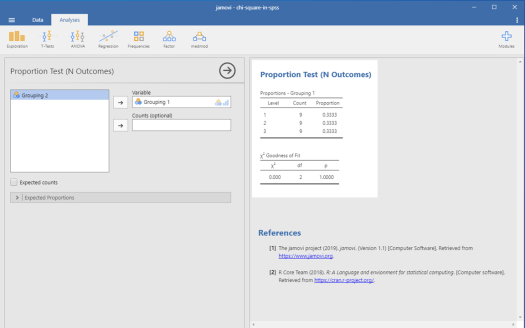
You can see that the p-value associated with Grouping 1 is 1.00. This is much greater than .05, which indicates that there is not a significant effect in the distribution of observations for Grouping 1. In other words, there are an equal number of people in each group for Grouping 1, which is reflected in the first table – nine people in each group.
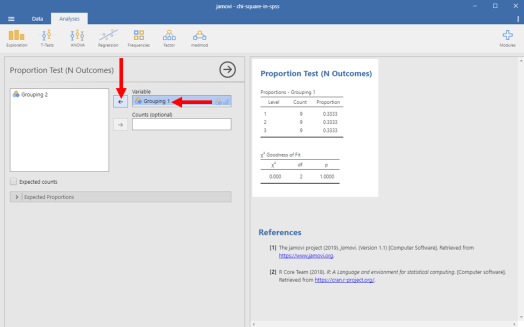
Next, let’s calculate the same analysis for Grouping 2. To do this, click on Grouping 1 (again), and then click on the same arrow that you did before. Now, it should be left facing.
Chi-Square in Jamovi Picture 7
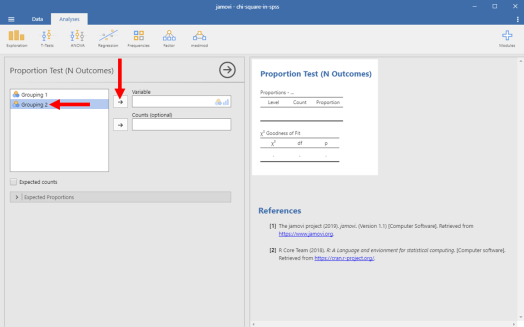
And then click on Grouping 2, and click on the same arrow once again. It should now be right facing.
Chi-Square in Jamovi Picture 8
You should now get the results that you see in the image below:
Chi-Square in Jamovi Picture 9
You can see that the p-value associated with Grouping 2 is 1.00. This is much greater than .05, which indicates that there is not a significant effect in the distribution of observations for Grouping 2. In other words, there are an equal number of people in each group for Grouping 2, which is reflected in the first table – nine people in each group.
Lastly, we should investigate whether a significant interaction exists between these two variables regarding the distribution of participants. To assess this, we need to open a new window. To open it, click on “Frequencies” at the top.
Chi-Square in Jamovi Picture 10
And then click on “Independent Samples chi-square test of association”.
Chi-Square in Jamovi Picture 11
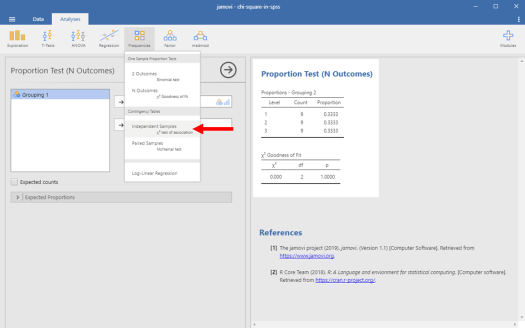
You should get a window that looks like the following:
Chi-Square in Jamovi Picture 12
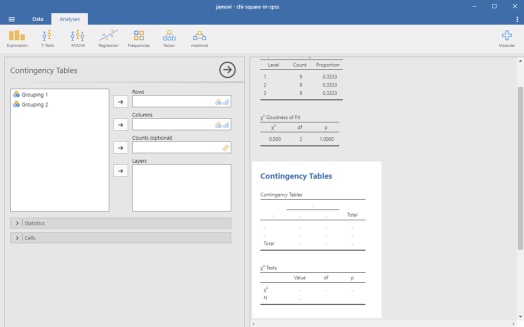
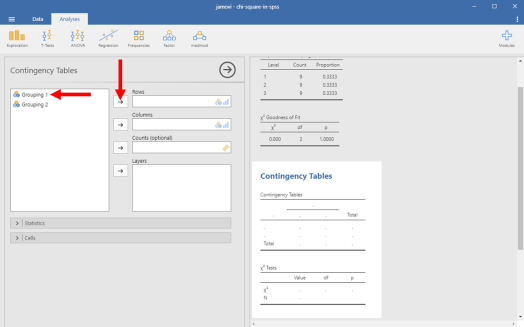
In this window, let’s put Grouping 1 in the Rows box. To do so, click on Grouping 1, and then click on the right-facing arrow next to the “Rows” box.
Chi-Square in Jamovi Picture 13
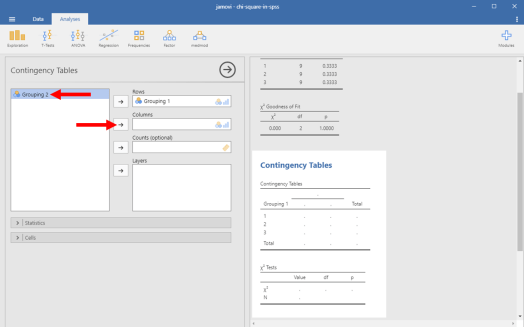
Then let’s put Grouping 2 in the Columns box. To do so, click on Grouping 2, and then click on the right-facing arrow next to the “Columns” box.
Chi-Square in Jamovi Picture 14
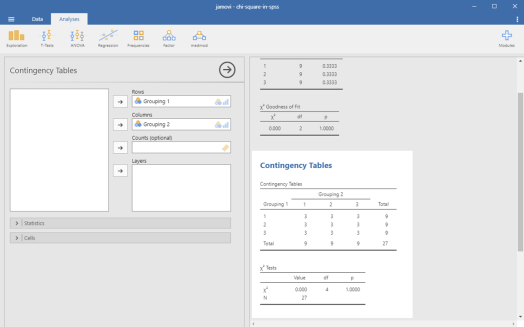
Jamovi should then calculate your output, as seen below:
Chi-Square in Jamovi Picture 15
Did you get the same result as this? If so, great! If not, go back and see where your analyses differed from mine.
From here, we see that our result was very similar to before. The p-value associated with the interaction of Grouping 1 and Grouping 2 was 1.000, which is much greater than .05. This means that the distribution of participants for Grouping 1 does not depend on Grouping 2 (and vice versa). We can see this in the contingency table, wherein there are three participants in each group.
That’s all for chi-square in Jamovi! As always, if you have any questions, please email me a MHoward@SouthAlabama.edu!
