
From learning about the one-way ANOVA, we know that ANOVA is used to identify the mean difference between more than two groups. A one-way ANOVA is used when we have one grouping variable and a continuous outcome. But what should we do if we have two grouping variables? As you’ve probably guessed, we can conduct a two-way ANOVA. Because this situation is fairly common, I created the page below to provide a step-by-step guide to calculating a two-way ANOVA in SPSS. As always, if you have any questions, please email me a MHoward@SouthAlabama.edu!
As mentioned, an ANOVA is used to identify the mean difference between more than two groups, and a two-way ANOVA is used to identify the mean difference between more than two groups when you have a two grouping variables and a continuous outcome. So, a two-factor ANOVA is used to answer questions that are similar to the following:
- What is the mean difference of test grades between left- and right-handed students, students in Dr. Howard’s and Dr. Smith’s classes, and the combinations of these groups?
- What is the mean difference in total output of factories defined by location as well as industry?
- What is the mean difference in performance for four different training programs, each performed at four different locations, and the combination of training program and location.
Now that we know what a two-way ANOVA is used for, we can now calculate a two-way ANOVA in SPSS. To begin, open your data in SPSS. If you don’t have a dataset, download the example dataset here. In the example dataset, we are simply comparing the means two different grouping variables, each with three different groups, on a single continuous outcome. You can imagine that the groups and the outcome are anything that you want.

If you data doesn’t look like this, you should probably reformat it to appear similarly. Calculating an ANOVA in SPSS may be a little difficult with different data formats.
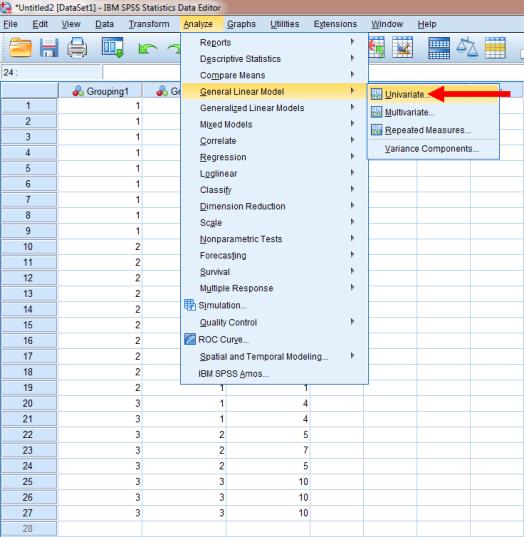
Like most analyses in SPSS, we are going to start by clicking the Analyze tab at the top, then General Linear Model, and then Univariate.
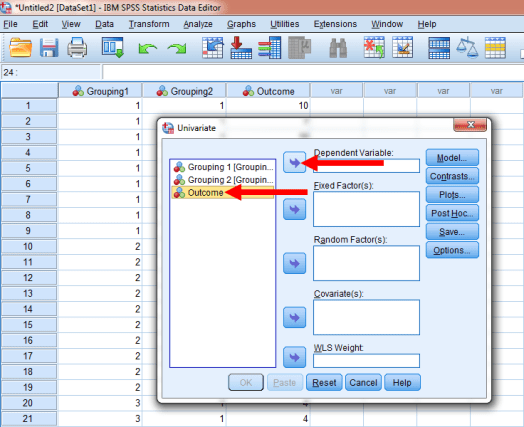
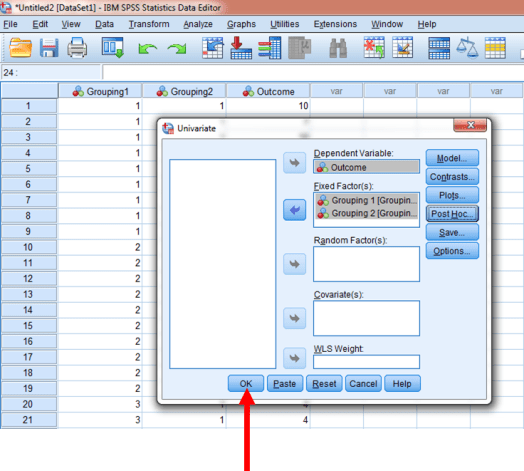
If it worked, the following window should have appeared. You’ll first want to put your outcome in the Dependent List. So, click on Outcome, and then click on the highlighted arrow.
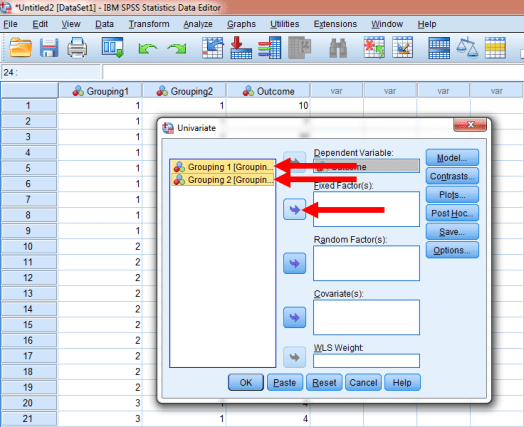
Now, we want to put our grouping variable as the Fixed Factor, because we are only interested in these specific groupings. So, click on Grouping 1 and Grouping 2, and then click on the button highlighted below:
Next, you’ll want to click on the Post Hoc button.
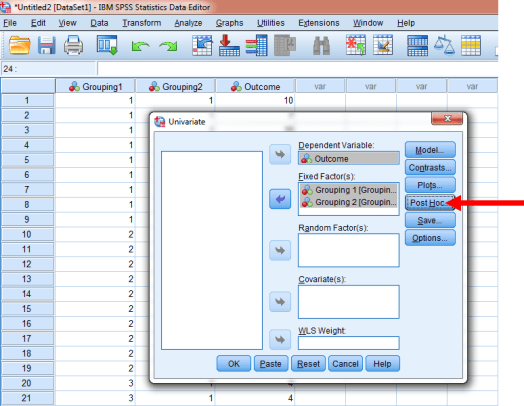
If you clicked the correct button, the following window should appear:
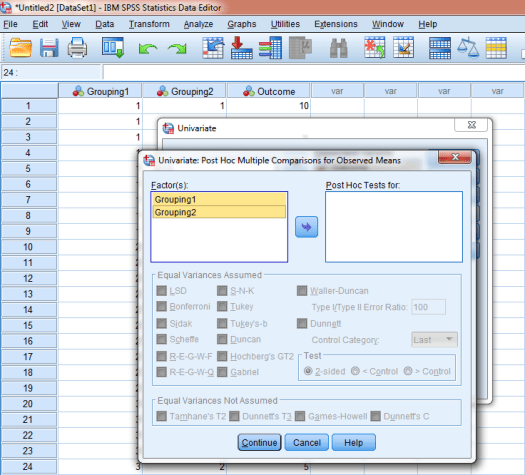
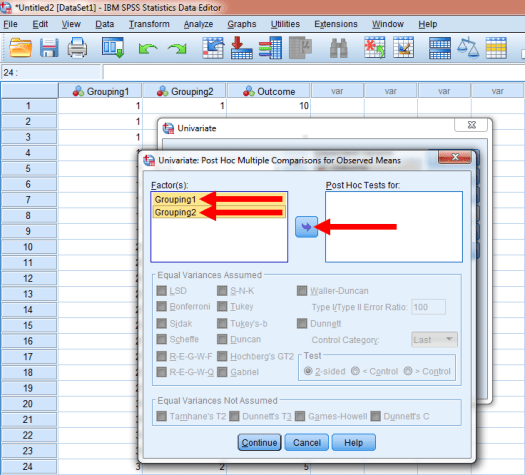
First, we want to put Grouping 1 and Grouping 2 in the Post Hoc Test window. To do so, highlight both variables and click the highlighted arrow.
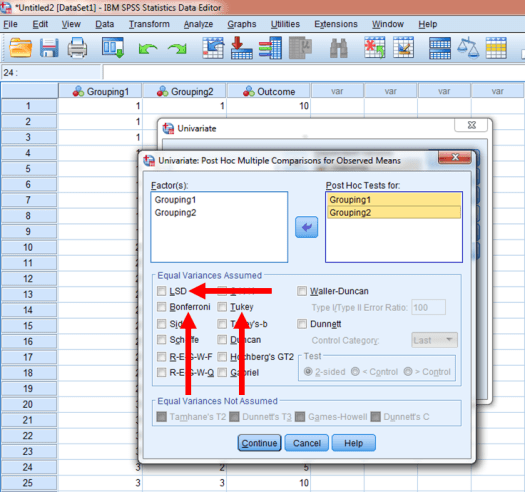
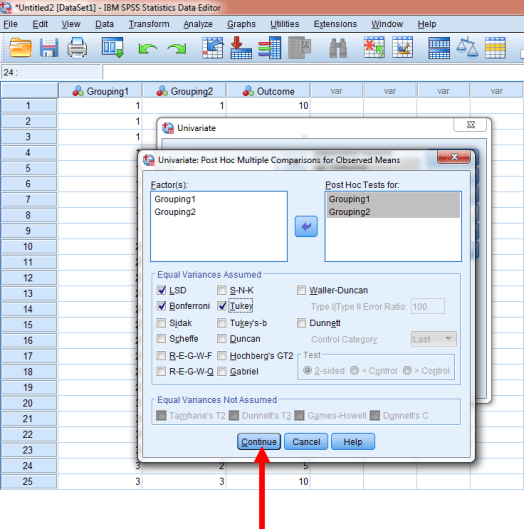
You’ll have a lot of options here for specific post hoc tests. You can choose whichever post hoc tests that you want, but I prefer to select LSD, Bonferroni, and Tukey. So, let’s click on the checkboxes for those three tests.
Click on Continue.
Then click on Okay.
If done correctly, you should get results. Great!
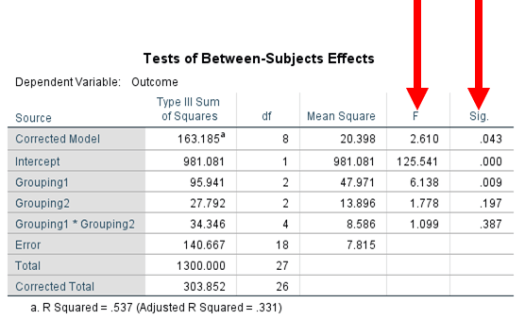
First, we can look at the F-values, but they don’t tell us too much by themselves. So, we can look at the p-values. As seen from the results below, only Grouping 1 had a significant group mean difference (p < .001), whereas Grouping 2 and the interaction term (Grouping 1 * Grouping 2) were not statistically significant (p > .05). So, we would say that the differences in the means of the first grouping variable were statistically significant. To identify the nature of these differences, however, we would have to analyze our post hoc tests. Because only Grouping 1 had a significant effect, we would only inspect the post hoc tests for Grouping 1.
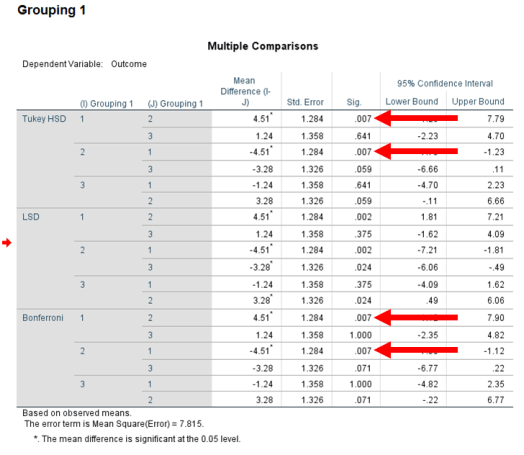
As seen below, the results of the Tukey HSD and Bonferroni tests provided similar inferences. Only the difference between Group 1 and Group 2 was statistically significant (p < .01). The difference between Group 1 and 3 as well as the difference between Group 2 and 3 were not statistically significant (p > .05). So, based on these two post hoc tests, we would say that the significant effect of Grouping 1 was driven by the difference between Group 1 and Group 2.
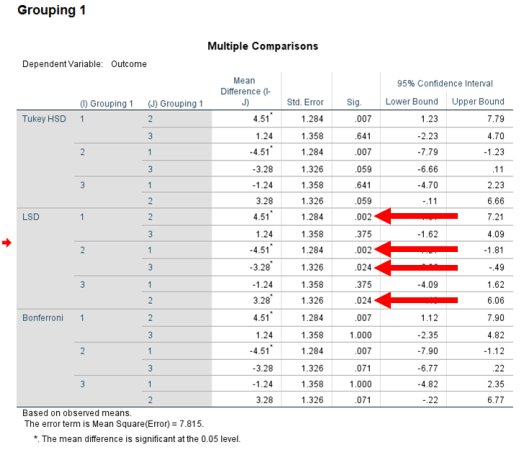
The LSD post hoc test, however, suggested that a significant different existed between Groups 1 and 2 as well as Groups 2 and 3 (p < .05), whereas no significant difference existed between Groups 1 and 3 (p > .05). Which should we use when our results differ? Well, it is up to you, the researcher. If you can make an argument that the LSD post hoc test is more appropriate, then you should use it. If you can make the argument that the Tukey HSD and/or the Bonferroni post hoc tests are more appropriate, the you should use them. In my experiences, people tend to be more accepting of conservative post hoc tests, such as Tukey HSD or the Bonferroni, because you are more certain about any significant results.
That’s all for the two-way ANOVA in SPSS. As always, if you have any questions, please email me a MHoward@SouthAlabama.edu!
