
Sometimes you want to know the relationship of X and Y when accounting for Z. This is a particularly good situation to apply a partial correlation analyses. Partial correlations are not pre-programmed into Excel’s Data Analysis add-on, but they are very easy to calculate in SPSS. For this reason, this page is a brief lesson on how to calculate partial correlations in SPSS. As always, if you have any questions, please email me at MHoward@SouthAlabama.edu!
A partial correlation determines the linear relationship between two variables when accounting for one or more other variables. Typically, researchers and practitioners apply partial correlation analyses when (a) a variable is known to bias a relationship (b) or a certain variable is already known to have an impact, and you want to analyze the relationship of two variables beyond this other known variable. Thus, partial correlations can be used to answer the following questions and similar others:
- What is the relationship of leader ability and job performance when accounting for follower job satisfaction?
- What is the relationship of hour studied and test grades when accounting for prior test performance?
- What is the relationship of employee mood and job performance when accounting for social desirability?
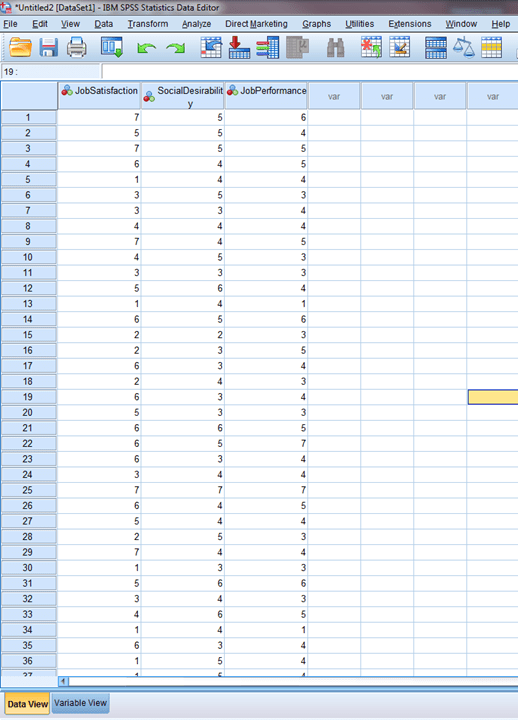
Of course, there is more nuance to partial correlations, but we will keep it simple. To answer these questions, we can use SPSS to calculate a partial correlation. If you don’t have a dataset, you can download the example dataset here. In the dataset, we are investigating the relationship of job satisfaction and job performance when accounting for social desirability.
The data should look something like this:
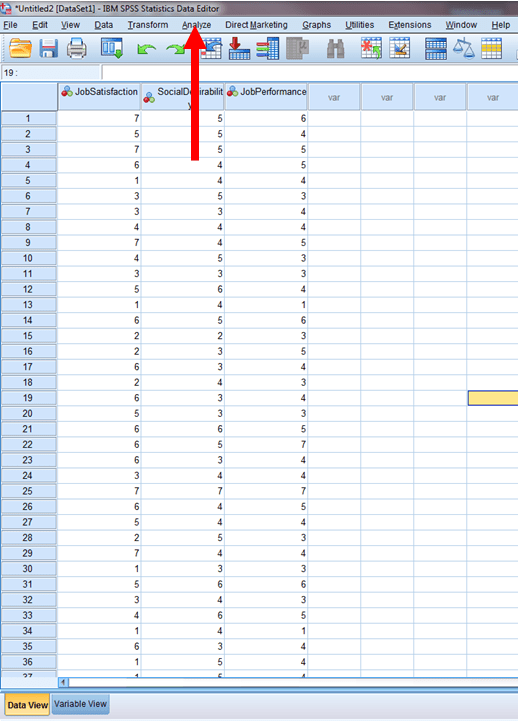
First, click on Analyze.
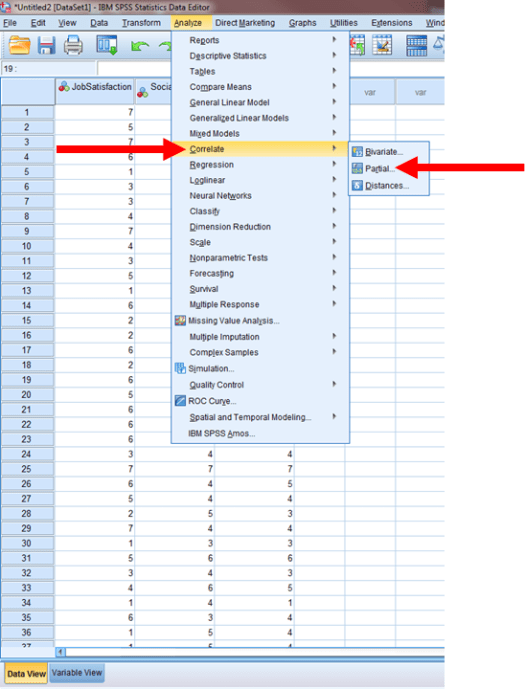
Then, click on Correlate and then Partial…
The new window should look something like this.
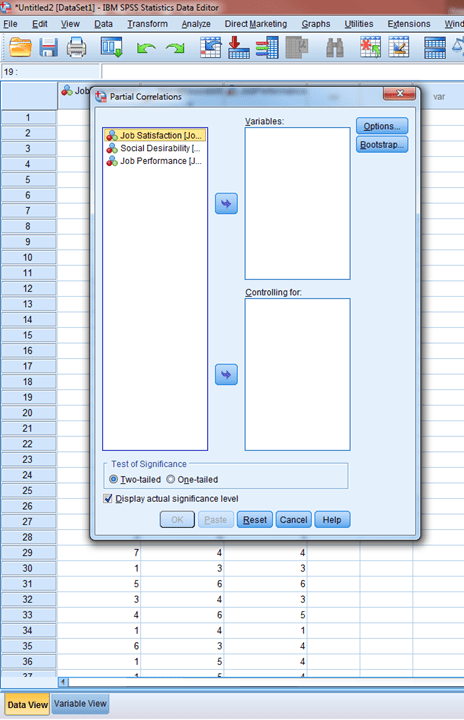
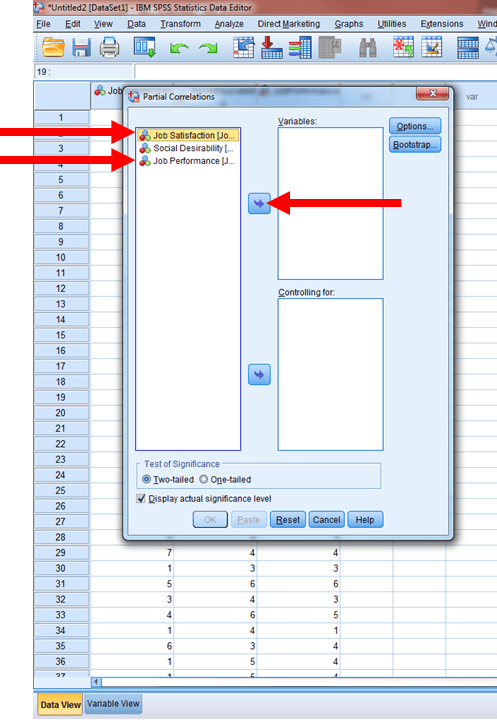
In this window, click on the variables that you are interested in testing their relationship, and then click on the arrow next to variables.
Then, click on the control variable, and then click on the arrow next to the window controlling for.
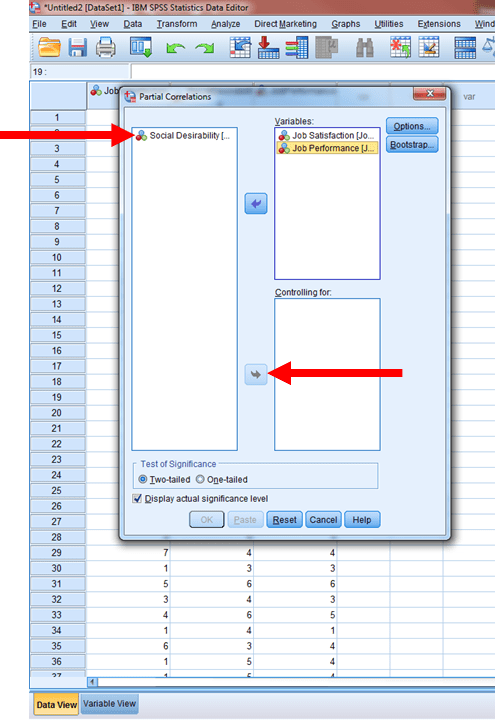
Lastly, press OK.

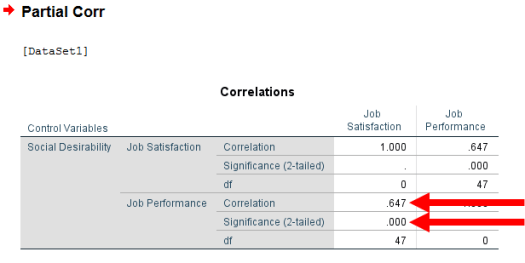
We should get results. Yay! From these results, we can identify the partial correlation between job satisfaction and job performance when controlling for social desirability. The partial correlation is .65 (p < .001). Therefore, the relationship between job satisfaction and job performance is statistically significant even when controlling for social desirability.
That is all for partial correlation, and now you should be able to perform one in SPSS. As always, if you have any questions or comments, please email me a MHoward@SouthAlabama.edu!
