
Sometimes you want to know the relationship of X and Y when accounting for Z. This is a particularly good situation to apply a partial correlation analyses. Partial correlations are not pre-programmed into Excel’s Data Analysis add-on, but they are very easy to calculate in R. For this reason, this page is a brief lesson on how to calculate partial correlations in R. As always, if you have any questions, please email me at MHoward@SouthAlabama.edu!
A partial correlation determines the linear relationship between two variables when accounting for one or more other variables. Typically, researchers and practitioners apply partial correlation analyses when (a) a variable is known to bias a relationship (b) or a certain variable is already known to have an impact, and you want to analyze the relationship of two variables beyond this other known variable. Thus, partial correlations can be used to answer the following questions and similar others:
- What is the relationship of leader ability and job performance when accounting for follower job satisfaction?
- What is the relationship of hour studied and test grades when accounting for prior test performance?
- What is the relationship of employee mood and job performance when accounting for social desirability?
Of course, there is more nuance to partial correlations, but we will keep it simple. To answer these questions, we can use R to calculate a partial correlation. If you don’t have a dataset, you can download the example dataset here. NOTE: The dataset that we are using does not include missing data. The R command that we’ll be using (pcor.test) has some issues with missing data. So, if you are using a dataset with missing data, you may want to consider removing it first and/or using a different command.
As you can see, the dataset is in the .xlsx format. To analyze it in R, we first need to convert it to .csv format. If you do not know how to do this, check out my page on opening .csv files in R. Once you have converted the file, you can continue with this guide.
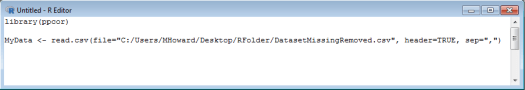
To calculate a partial correlation in R, we are going to use the ppcor package. Therefore, we need to first download and install this package. To learn how to download and install packages in R, please refer to my page on installing packages in R. Once you have installed the ppcor package, you should enter the following into your syntax window: library(ppcor) . This will activate the package that we just downloaded and installed.
Then, we need to input our data into R. You can label your dataset anything that you want, but we are going to use the following label for the current page: MyData . If you do not know how to input your data into R, again reference my page on opening .csv files in R.
From these preliminary steps, you should have something similar to the following in your syntax window:
Do you? If not, go back and try to figure out where you differed from the instructions above.
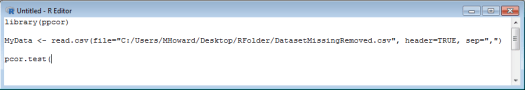
Now, we can enter our syntax to calculate the partial correlation. First, you’ll want to enter the appropriate command into the syntax window, which is: pcor.test( .
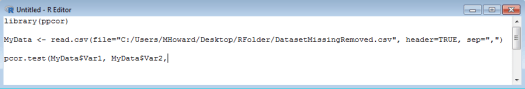
Then, when using this command, the first two variables (separated by a comma) that we specify are the X and Y variables. Because our variables have labels within our dataset, we can refer to them by typing MyData$VARIABLENAME. . .of course, replacing VARIABLENAME with the actual label of the variable.
Let’s go ahead and use Var1 and Var2 as our X and Y variables. So, we would type: MyData$Var1, MyData$Var2 . This can be seen below:
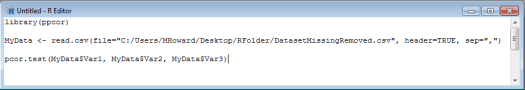
Now, the third variable that we enter (separated by a comma) is the variable that we control for. So, in the current example, we can type: MyData$Var3 .
Now, we can run our syntax.

Did you get this result? Or something similar? If so, great! The first number is the partial correlation (-.0007), whereas the second number is the p-value (.9899). In this example, our result would not be statistically significant.
But what if we want to control for two variables (e.g. Var3 and Var4)? Fortunately, this is pretty easy. We would start with the same first part of the syntax: pcor.text(MyData$Var1, MyData$Var2, . However, our following syntax slightly differs. To enter two control variables, such as Var3 and Var4, we need to use the list() command. So, we would type: list(MyData$Var3, MyData$Var4) . To finish, we would close our command by typing a final: ) . Your syntax should now look like this:
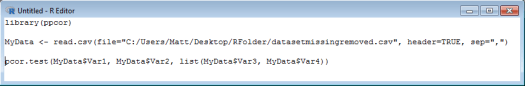
Two notes about this. First, you’ll see that my syntax for entering my data has slightly changed. YOU DO NOT NEED TO DO THIS. Mine changed because I did this final step on a different computer, so the path directories were slightly different. Second, there are several ways to control for two variables. I think this is just the easiest. IF you prefer other methods, go for it.
Anyways, let’s run our syntax and we should get…

Our effect size is .051, and our p-value is >.05. Still not statistically significant!
So there you go. Now, you should be able to calculate a partial correlation on your own. You can use the example dataset to practice with other combinations. If you still need help, feel free to email me at MHoward@SouthAlabama.edu with any questions or comments!
