
The need to conduct a one-sample t-test is much less frequent than the need to conduct a two-sample t-test. For that reason, it is easy to forget how to perform a one-sample t-test. Fortunately, I have created a guide for performing a one-sample t-test in R. As always, if you have any questions, please email me a MHoward@SouthAlabama.edu!
Before learning how to conduct a one-sample t-test in R, let’s briefly chat about their purpose. In general, a one-sample t-test is used to identify whether the mean value of a group is significantly different from a specified value (that you select). So, it may be used to answer research questions similar to the following:
- Is a class’s average grade significantly different than a value of 80?
- Is a group’s average height significantly different than 5’6″?
- Is a company’s yearly revenue significantly different than 10 million dollars?
These types of questions may be interesting, but they are honestly not all that common in research or practice. Often, selection an arbitrary value to test isn’t all that informative. However, I can think of a few examples in which a one-sample t-test may be useful:
- When you know a pre-defined value is important.
- When you have a certain expected value for a sample.
- When there is some common-sense value.
- When you are performing a replication study.
Of course, there are other situations in which a one-sample t-test may be useful, so keep your eyes our for these scenarios!
Now that we know what a one-sample t-test is used for, we can now calculate a one-sample t-test in R! To begin, open your data in R. If you don’t have a dataset, download the example dataset here. In the example dataset, we have four variables named Var1, Var2, Var3, and Var4. Be aware, however, that this dataset is in the .xlsx format, and the current guide requires the file to be in .csv format. For this reason, you must convert this file from .xlsx format to .csv format before you can follow along using this dataset. If you do not know how to do this, please visit my page on converting a file to .csv format. After converting the file, you can continue with this guide.
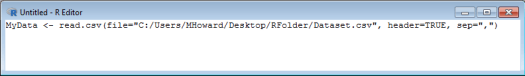
First, you must import your data to R. For a full guide on how to do this, please visit my page. For the current examples, we are going to label our data as: MyData.
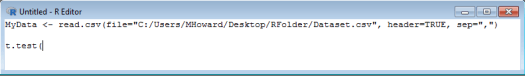
We are going to use the t.test() command. So, type in: t.test( .
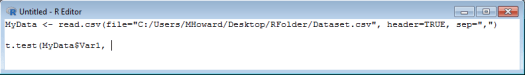
The next thing we want to enter is the variable that we’ll be testing. Let’s start with Var1 in our dataset. To reference this variable, we would type in: MyData$Var1, .
Now, we need to type the number that will be compared to the mean of Var1. Let’s choose the number 25. To do so, we should type: mu=25) .
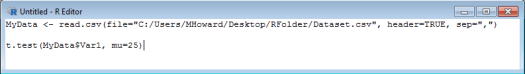
At this point, we could add more things to our syntax depending on our needs. The default for this command is a two-tailed significance test, but we can specify a one-tailed significance test if we wanted. We could also specify various confidence levels. For our current purposes, let’s just leave everything as the default and run our syntax.
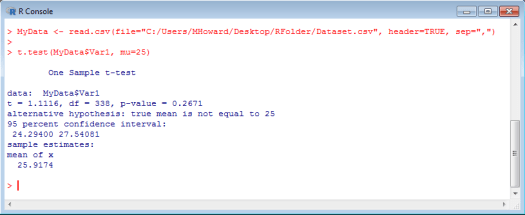
Did you get something like the output above? As we can see, the p-value is above .05, so our results are not statistically significant. Also, the confidence interval includes the number that we are testing (25), which again supports that our results are not statistically significant.
If you want, go through and test the other variables against values of 5 (Var2), 3 (Var3), and 4 (Var4). If you have any questions or comments, please email me a MHoward@SouthAlabama.edu. That is all for one-sample t-tests! Thanks for reading!
