
Most analyses that I review on MattCHoward.com involve direct effects alone; that is, the direct relationship between a predictor and an outcome, such as job satisfaction predicting job performance. Sometimes we want to test, however, whether a variable influences the relationship between two other variables, such as whether agreeableness influences the relationship between job satisfaction and job performance. We call this a moderated or interactive effect, and it can be tested in Excel. This page will teach you just how to do that. If you have any questions after reading, feel free to email me at MHoward@SouthAlabama.edu.
A moderating variable influences the relationship of two other variables. For instance, when people’s agreeableness is low, the relationship between job satisfaction and job performance may be almost nonexistant. When their agreeableness is high, however, the relationship between job satisfaction and job performance may be positive and extremely strong. In this case, we have more than just direct effects at play – we also have moderating effects (aka interactive effects). Some other questions that you may investigate when testing moderating effects may be:
- Does the relationship between conscientiousness and job commitment depend on tenure?
- Does the relationship between R&D funding and profit depend on company size?
- Does the relationship between stress and alcohol use depend on age?
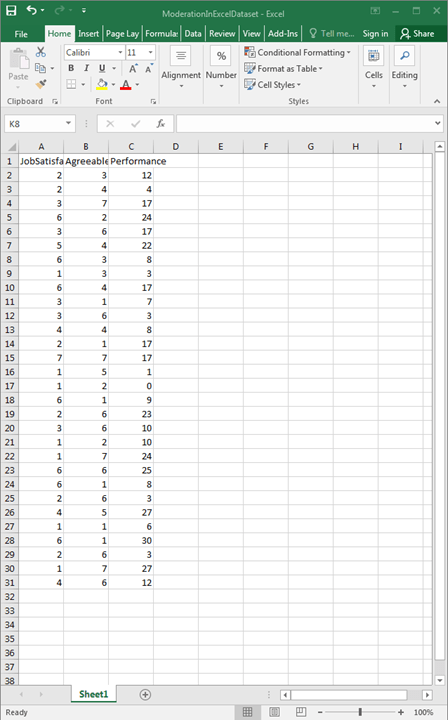
The most basic type of moderation analysis in Excel includes a single predictor, a single moderator, and a single outcome. Of course, this is where we will start. If you don’t have a dataset, you can download the example dataset here. In this dataset, we are investigating the direct effect of Job Satisfaction on Performance, and we are also testing whether Agreeableness moderates this relationship.
The data should look something like this:
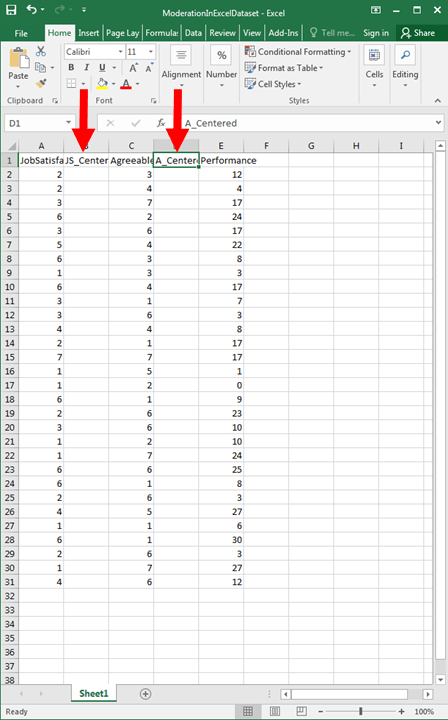
To begin, we need to mean-center our predictor and moderator. To do this, we subtract each value of the predictor by its mean as well as to subtract each value of the moderator by its mean. So, we need to go ahead and add columns to hold these mean-centered values. I always add the new columns next to the variables that I want to mean-center. Go ahead and add a title to these columns, too, as seen in the image below.
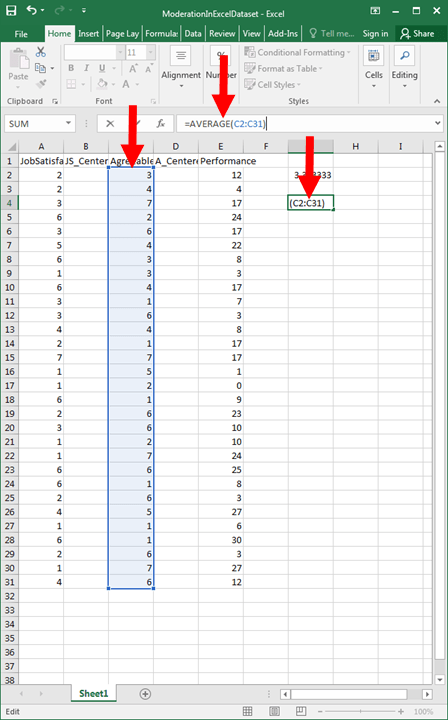
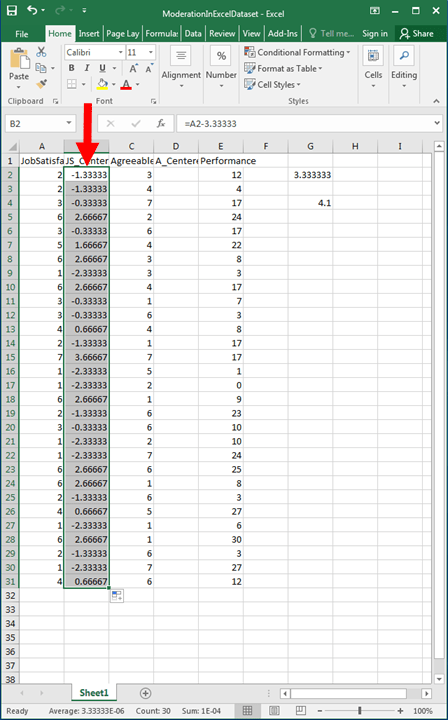
We now need to determine the means of the Job Satisfaction and Agreeableness variables. In a cell off to the side, type “=average(” (without the quotation marks for all directions).
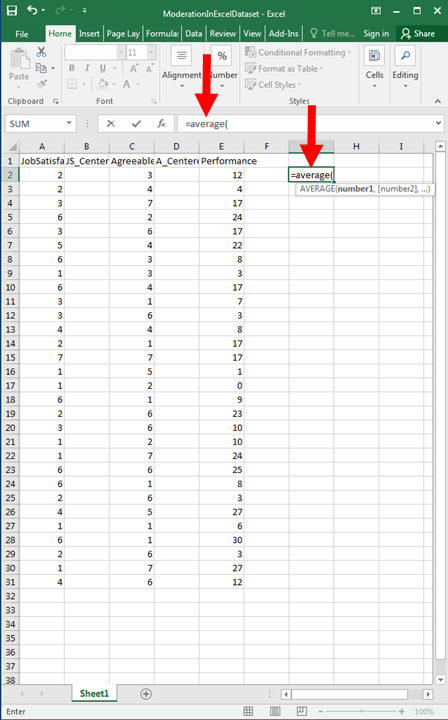
Then, highlight the data for Job Satisfaction, and close your command by typing “)”. Press enter. This should provide the mean for Job Satisfaction.
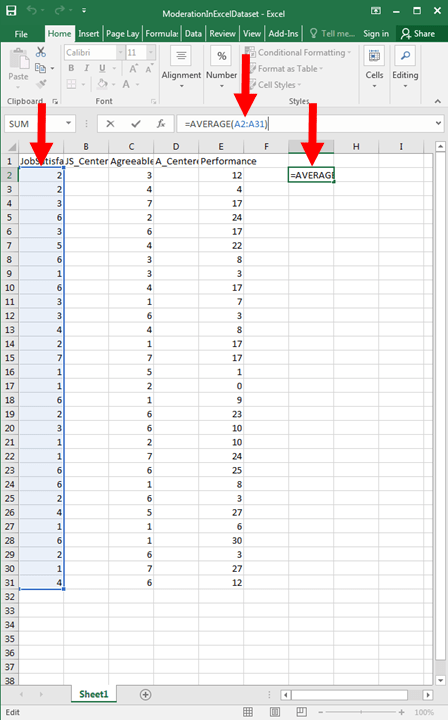
Let’s do the same for Agreeableness.
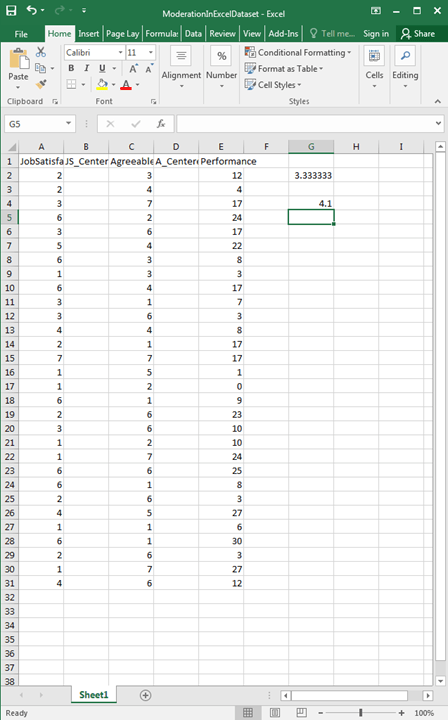
We should now have the means of Job Satisfaction and Agreeableness. If you are using the example dataset, they are 3.33333 and 4.1, respectively.
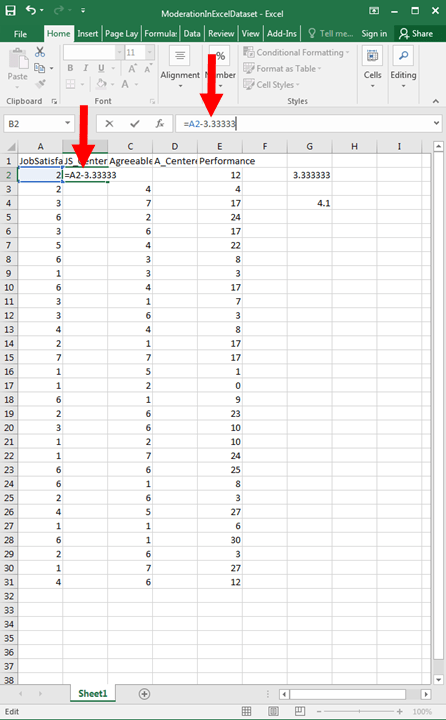
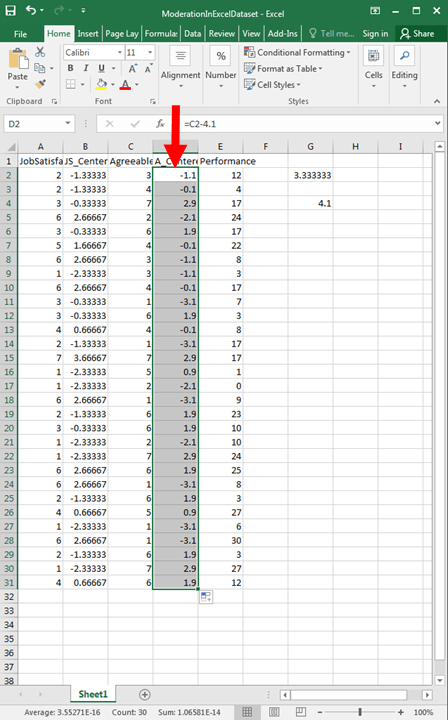
To mean center, we need to subtract 3.33333 from each observation of Job Satisfaction and 4.1 from each value of Agreeableness.
Let’s start with the first cell of Job Satisfaction. In the JS_Centered column (seen below), type “=”, click on the first Job Satisfaction cell, type “-3.333333”, and hit enter. This will calculate the mean-centered value for the first observation of Job Satisfaction.
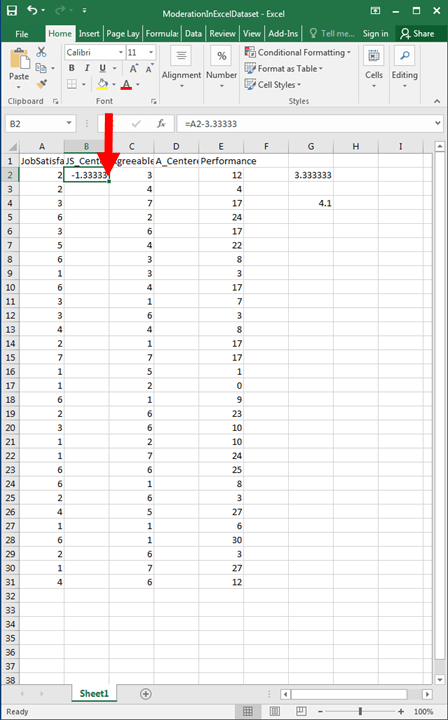
We now want to do the same thing for all the other cells. Click on the cell that you just created. Then, double-click on the little box in the bottom-right corner of the cell. This will copy the cell contents in the rest of the cells for that column. Neat!
You should now have a completed JS_Centered column, as seen in the image below.
Let’s do the same for Agreeableness. In the first cell, type “=”, click on the first Agreeableness cell, type “-4.1”, and hit enter.

Then do the same thing to copy that command into the other A_Centered cells. If you did it correctly, it should look like the image below.
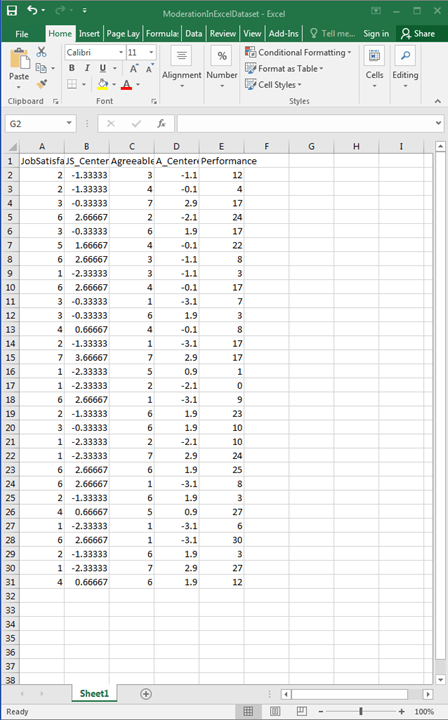
Go ahead and delete those two means that were off to the side. We don’t need those anymore.
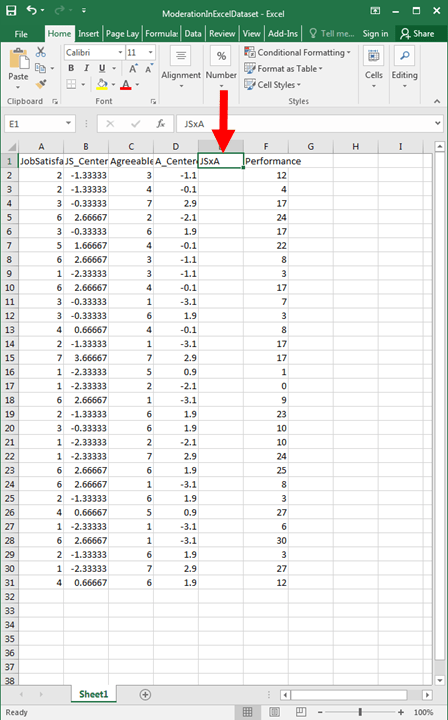
Now, we need to create the column for the interaction term. Add that and give it a title. I named mine JSxA.
To create the interaction term, we need to multiply the two respective mean-centered columns. Let’s start with the first row to do this. In the first cell of the new interaction term column, type “=”, click on the first cell of the JS_Centered column, type “*”, click on the first cell of the A_Centered column, and hit enter. This should produce the two numbers multiplied together in that column.
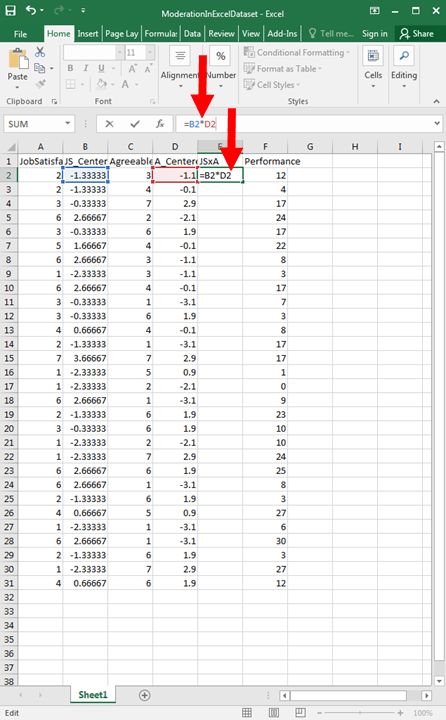
Click on the box within the cell to copy that command into the other cells.
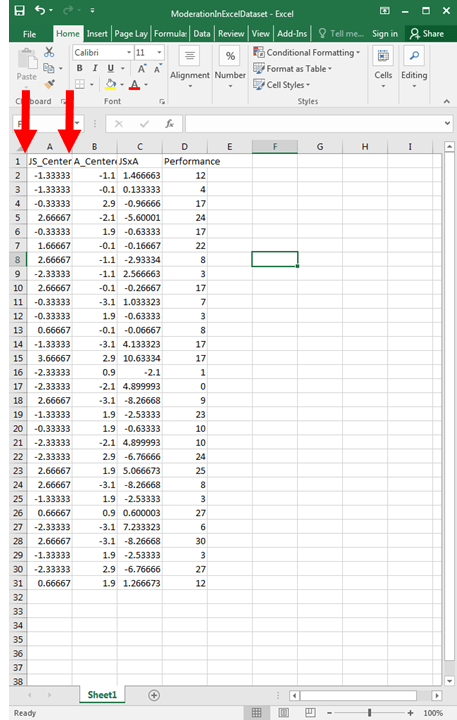
Now we have all the data that we need! There is one last thing that we need to do, though. Excel requires our mean-centered columns and our interaction term to be next to each other to conduct the moderated regression analysis. So, we need to delete the original Job Satisfaction and Agreeableness columns. To do this, though, we need to transform the equations that we just typed into raw numbers.

To transform the equations into numbers, click on the select-all button highlighted below. Then, right click on the data area, and click on copy. And then, right click on the data area again, and click on “Paste as Values”. You may need to hover your mouse over the icons to determine which one is “Paste as Values”, but click on it once you figure it out. Once you do this, your data will look the same, but the prior formulas will just be raw numbers. Do see if you did it correctly, click on the cells in the interaction term column. Does Excel just list the number? Or does it list the formula in the text window? If it is just the number, great! If it is the formula, try to “Paste as Values” again. Email me if you need help!

Now, go ahead and delete the original Job Satisfaction and Agreeableness columns.
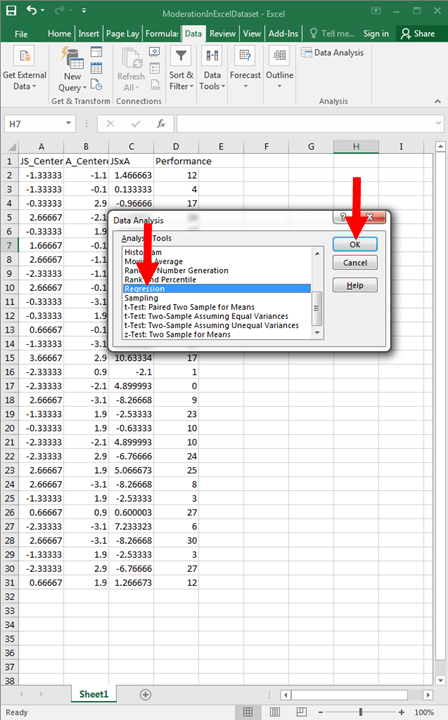
Phew! That was a low of work. Let’s just run our regression now like we always do. Click on the Data tab and then the Data Analysis button.

Click on Regression and then the OK button.
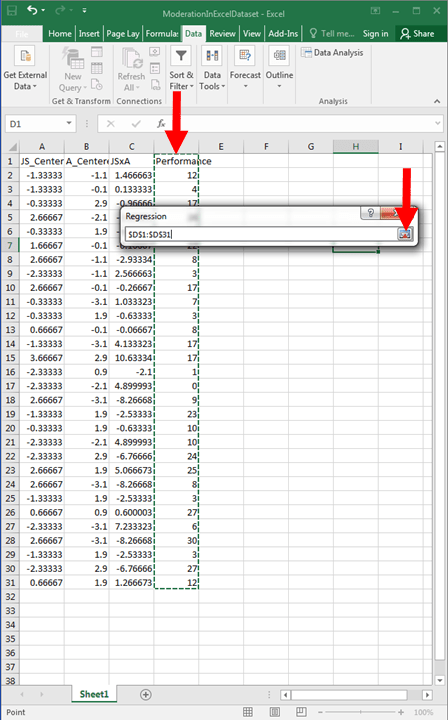
Click on the highlighted button below, which is to tell Excel where our outcome data is located.
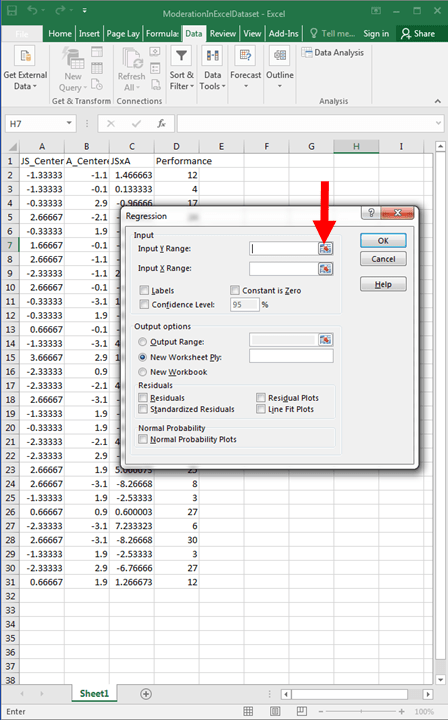
Highlight our outcome data (Performance), and make sure that you include the label! Then hit the highlighted button below.
Hit the highlighted button below to tell Excel where your predictor data is located.
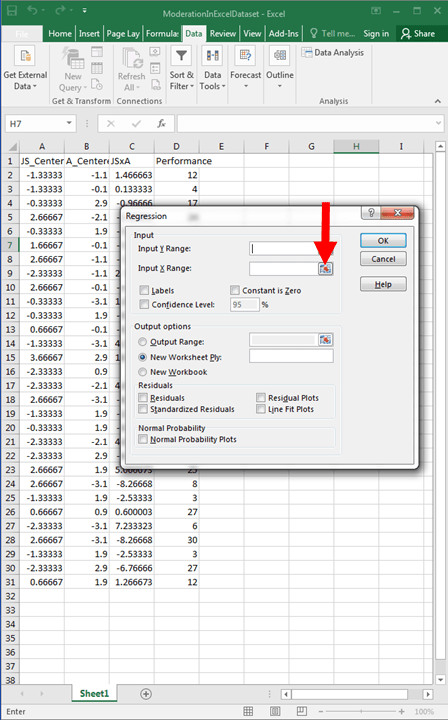
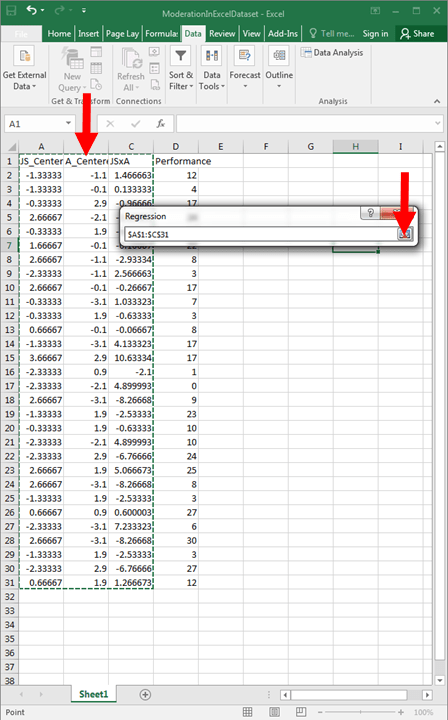
Highlight the JS_Centered column, the A_Centered column, and the JSxA column. Make sure you include the labels and then hit the highlighted button below.
Check the Labels box, and then hit the OK button.

We should now have our results. Good work!
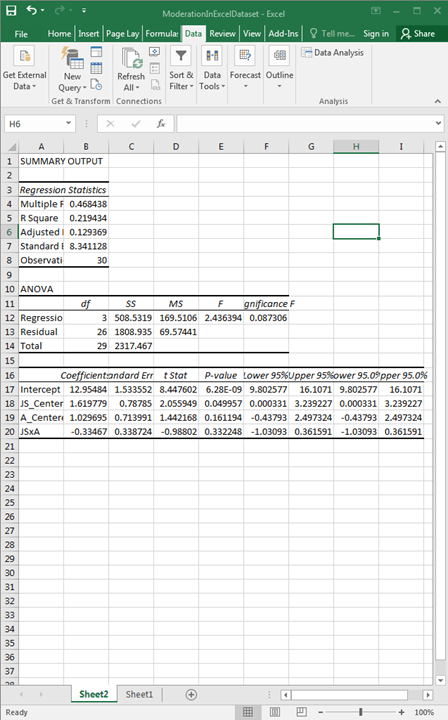
The first row tells us the direct effect of JS_Centered on Performance. As we can see, it is statistically significant, so we would say that job satisfaction has a significant direct effect on performance.
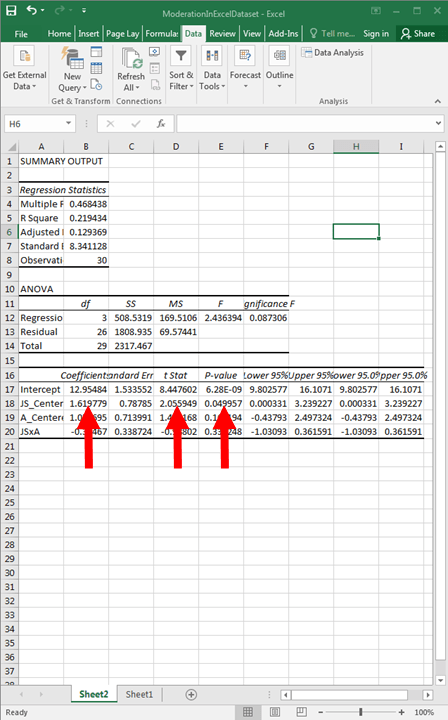
The next row is the direct effect of A_Centered on Performance. It is not statistically significant, so we would say that agreeableness does not have a significant direct effect on performance.

The third row is the interaction of JS_Centered and A_Centered on Performance. It is not statistically significant, so we would say that there is no significant interaction effect of job satisfaction and agreeableness on performance.
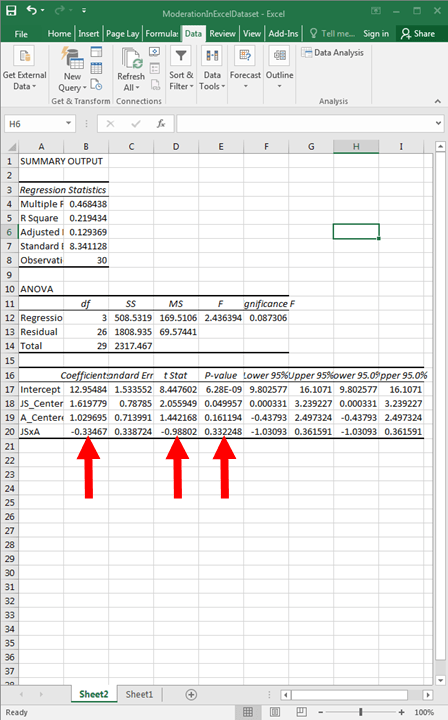
Together, Job Satisfaction had a significant direct effect, Agreeableness did not have a significant direct effect, and the interaction term was not significant. So, only Job Satisfaction was important in predicting Performance.
Great work on following this guide. It is long and difficult, but moderation is a very important concept. If you have any questions whatsoever, please email me at MHoward@SouthAlabama.edu!
