
In research, we most often test direct effects. That is, a direct effect is a relationship between a predictor and an outcome, such as job satisfaction predicting job performance. Sometimes we want to test, however, whether a third variable explains the relationship between two other variables, such as whether motivation explains the relationship between job satisfaction and job performance. We often call this a mediating effect or an indirect effect, which can be tested in Excel with the help of a website or two. This page will teach you how to do just that. If you have any questions after reading, please email me at MHoward@SouthAlabama.edu.
A mediating variable explains the relationship between two other variables. For instance, we may know that job satisfaction relates to job performance, but we may not know the exact reason. We could test to see, though, whether people’s job satisfaction leads to greater motivation, which then leads to greater job performance. If significant, we would then say that motivation is a mediator between job satisfaction and job performance. If this is the case, then we would have an indirect effect of job satisfaction on job performance via motivation. Some other questions you could ask when investigating mediation could be:
- Whether social undermining explains the negative relationship between team member Machiavellian and team performance.
- Whether time studying explains the positive relationship between conscientiousness and grades.
- Whether time partying explains the negative relationship between extraversion and grades.
And here is a visual representation of mediation:
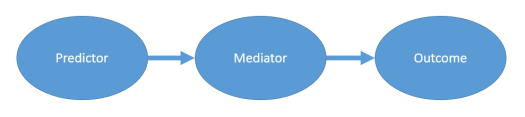
The most basic type of mediation in Excel using a Sobel test includes a single predictor, a single mediator, and a single outcome. This is what we will use for the current example. If you don’t have a dataset, you can download the example dataset here. In this dataset, we are investigating the direct effect of Job Satisfaction on Job Performance, and we are also testing whether Motivation mediates this relationship. In other words, we are testing whether Motivation explains the relationship between Job Satisfaction and Job Performance.
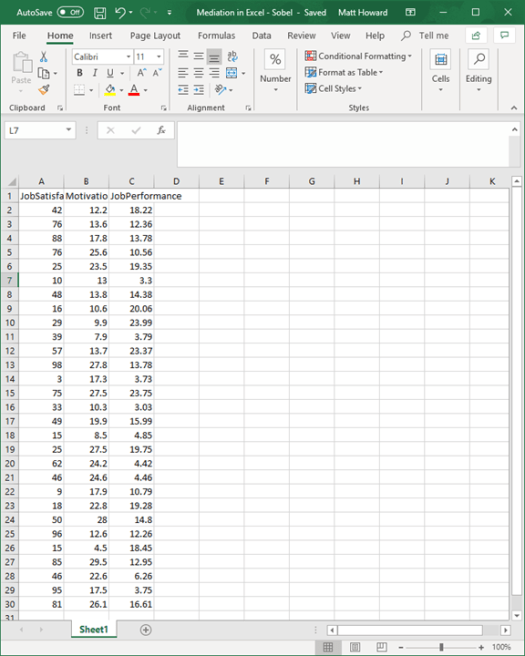
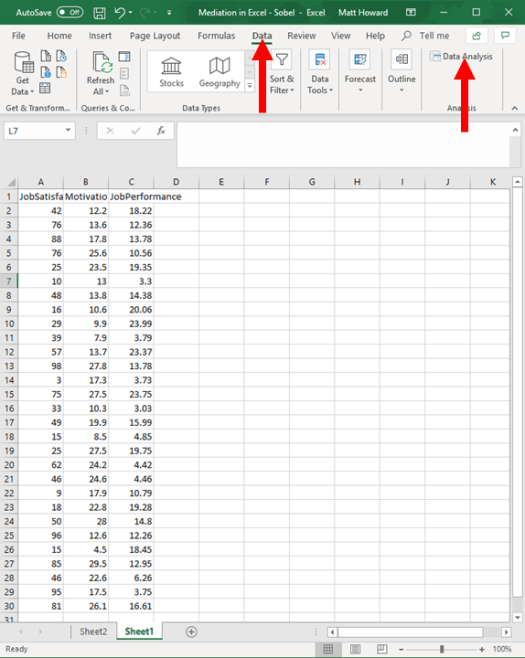
The dataset should look like this:
To conduct the Sobel test for mediation, we want to perform two separate regression analyses. The first will investigate the effect of the predictor on the mediator. The second will investigate the effect of BOTH the predictor and the mediator on the outcome. Let’s go ahead and conduct the first of these regression analyses.
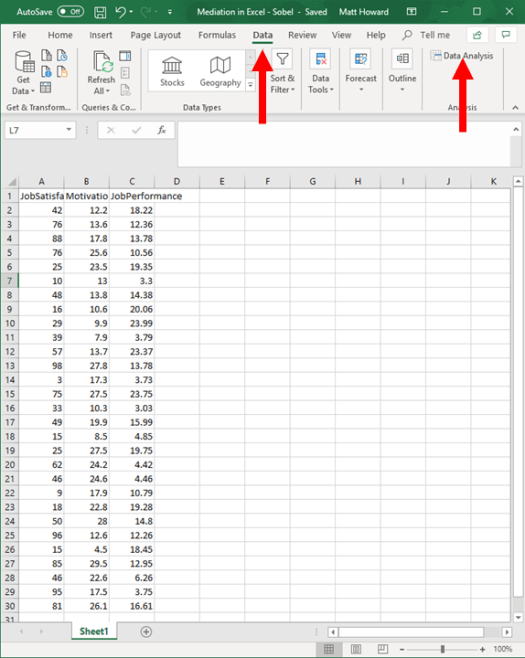
Like always, we want to start our analysis by going to the Data tab and clicking on Data Analysis.
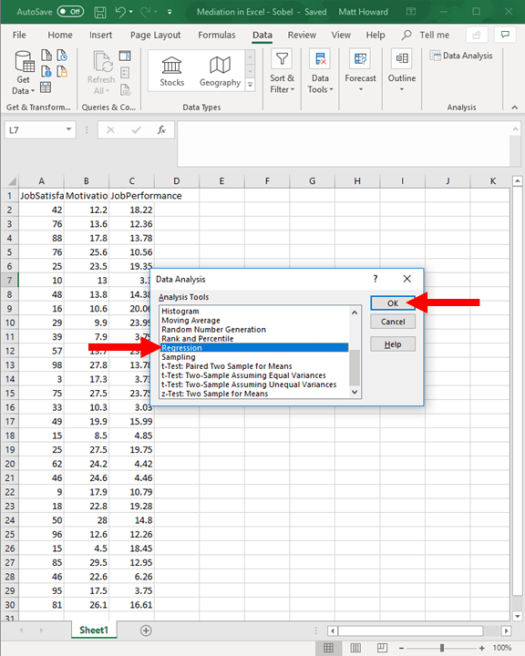
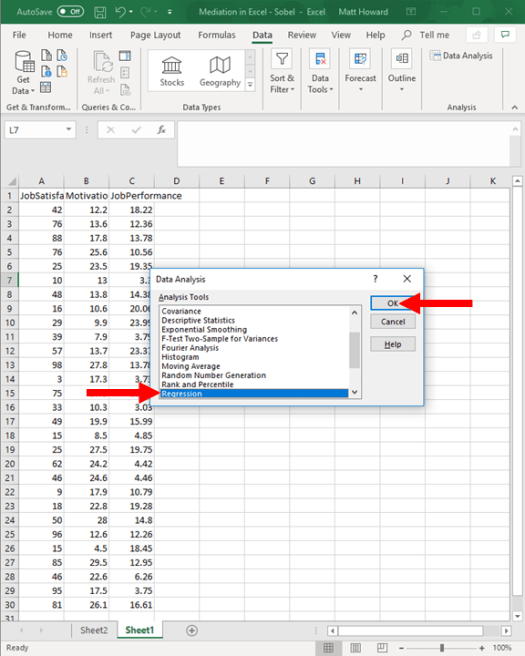
Then scroll down to Regression and click OK.
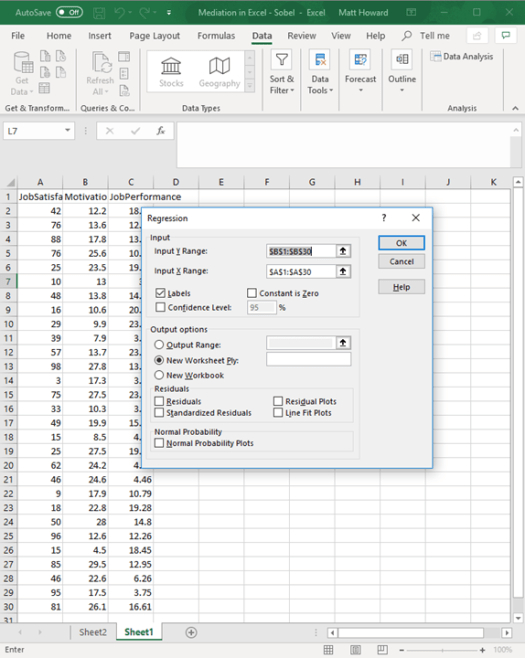
You should see the following window:
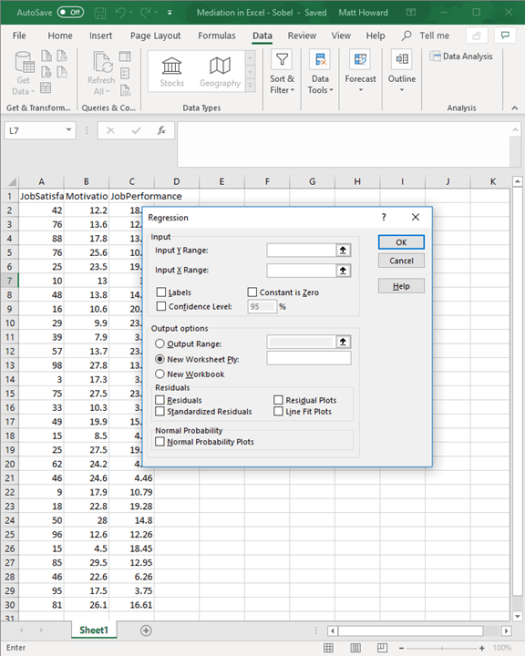
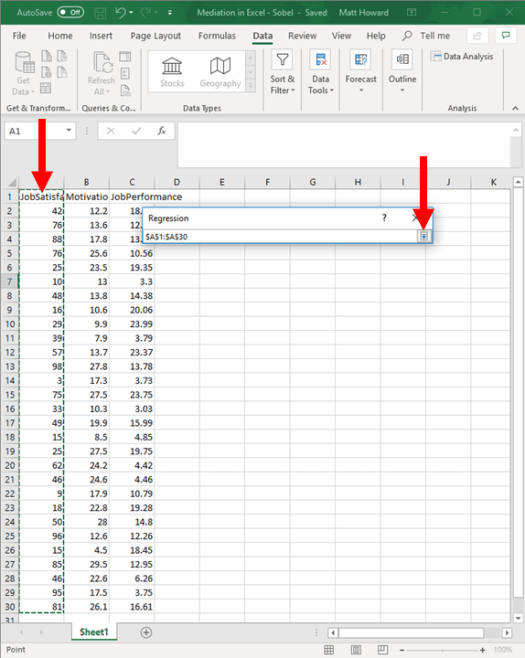
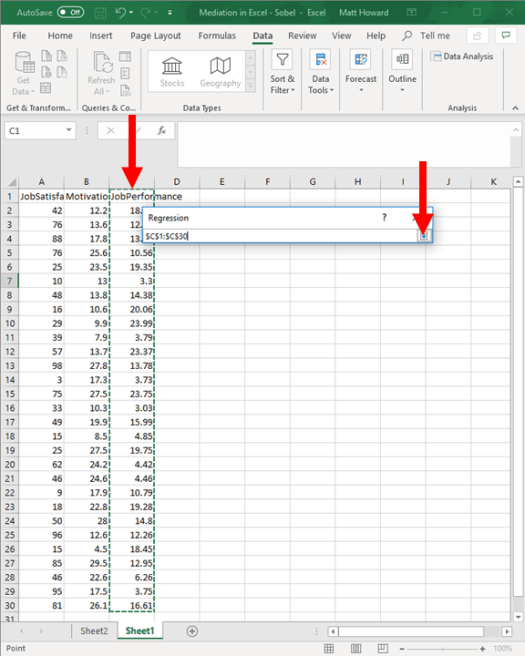
Now, we need to tell Excel what data represents our outcome. Click on the highlighted button.
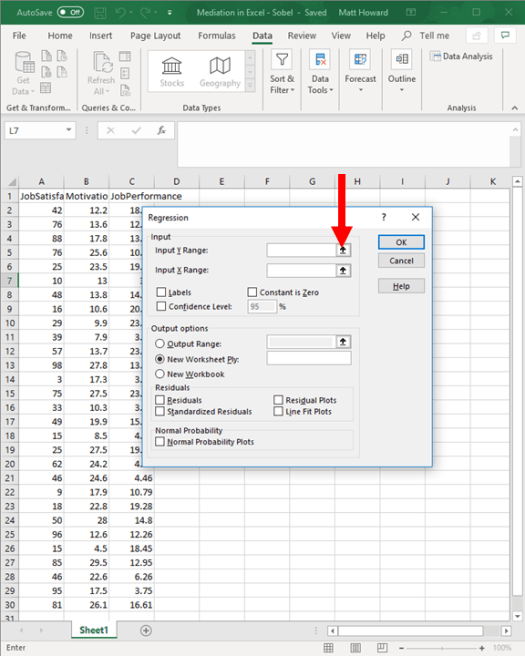
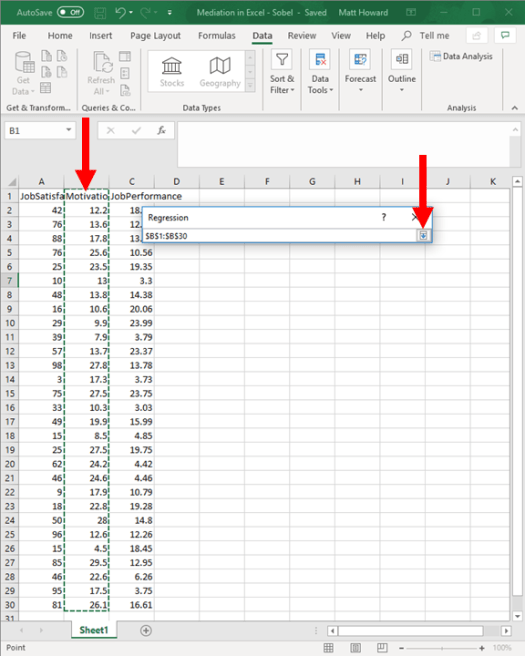
Because we are first testing the relationship of the predictor on the mediator, we want to highlight the mediator as our outcome data within this first regression. So, highlight the mediator data and label, and then click on the button highlighted below.
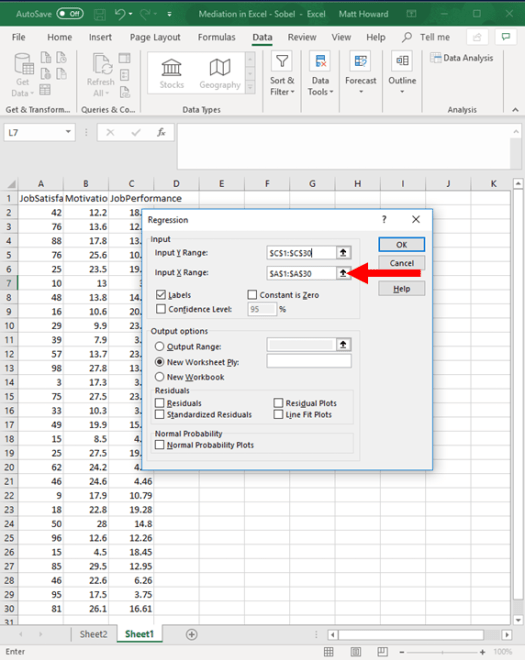
Next, we need to tell Excel what data is our predictor data. Click on the highlighted button below.
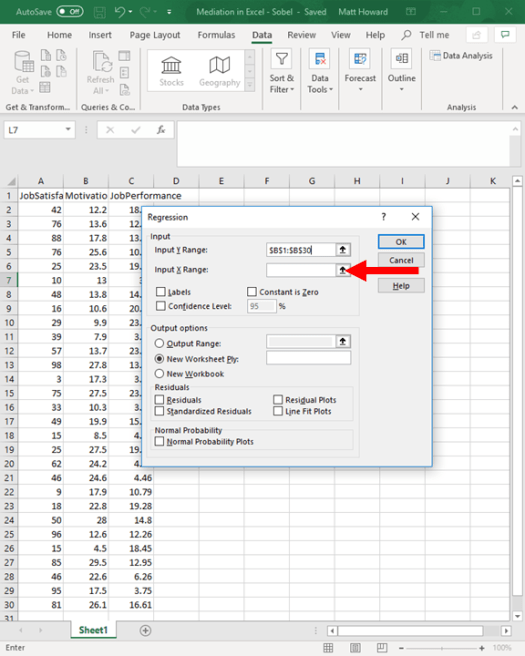
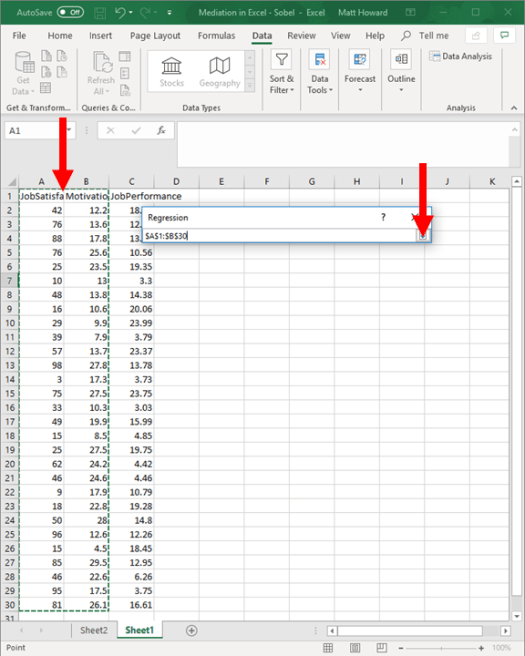
Now, highlight your predictor data and label, then click on the other button highlighted below.
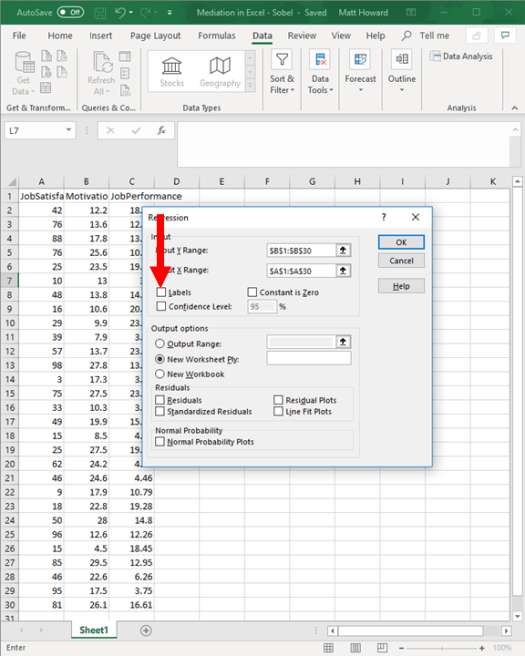
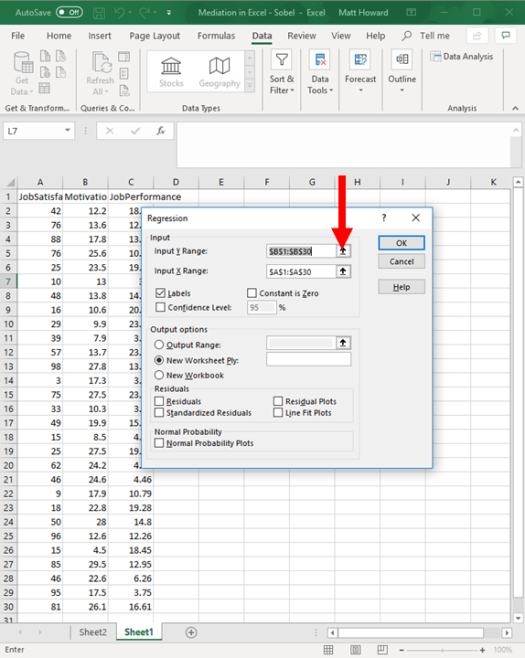
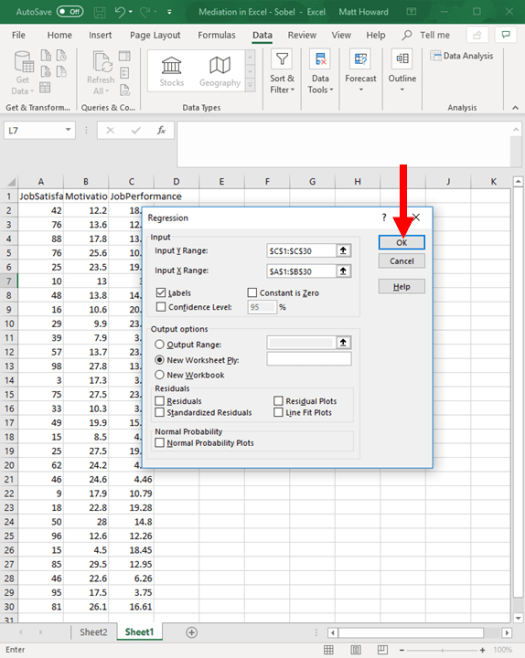
Of course, because we included the labels in highlighting our data, we need to click the Labels checkbox that is highlighted below:
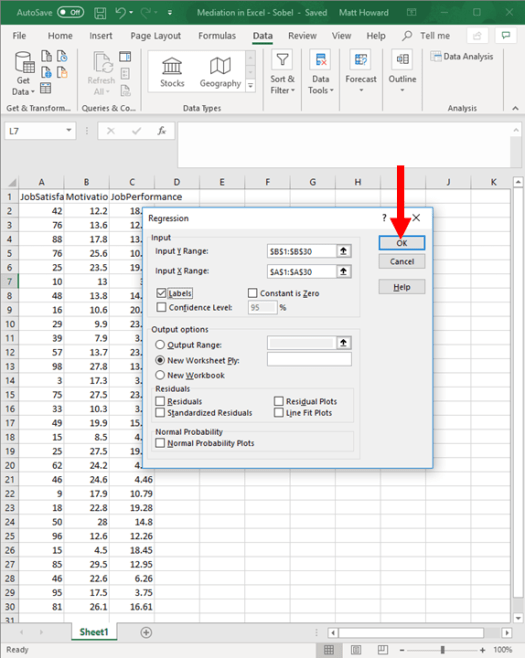
And press OK.
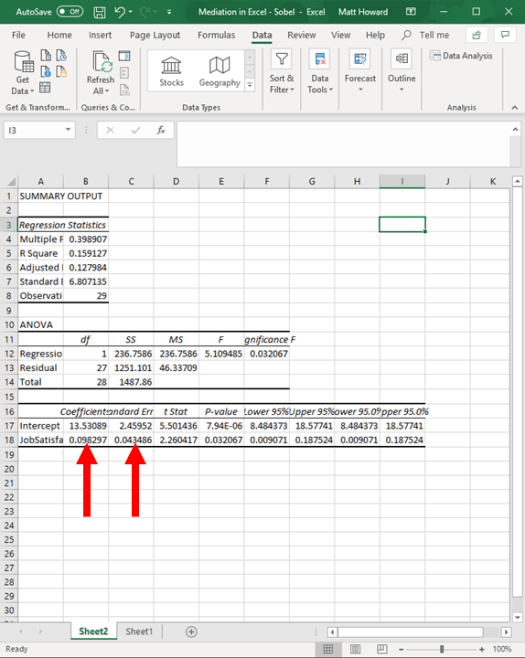
You should get the output below.
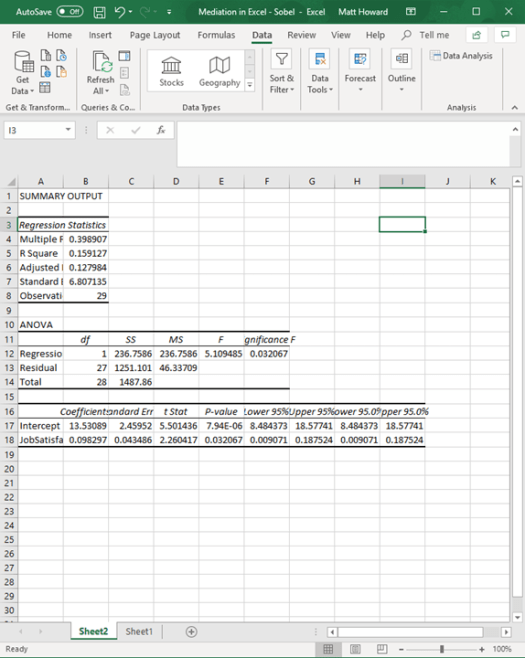
From this, we only need to look at the effect of Job Satisfaction on Motivation. From a brief look, we can see that the effect is statistically significant with a p-value that is less than .05. At this point, we will also want to write down the unstandardized beta coefficient and the standard error of Job Satisfaction’s effect. We will need this later, so don’t forget it!
Now, let’s go back to the original data sheet. You can get there by clicking on the Sheet1 tab at the bottom of the screen. From there, click on Data and then Data Analysis, again.
Again, scroll down to Regression and click OK.
And you should get to this window again:
Now, we want to conduct a regression in which BOTH Job Satisfaction and Motivation predict Job Performance. To do so, first click on the highlighted button to tell Excel where the new outcome data is (Job Performance).
Now, highlight the Job Performance data and label, then click on the highlighted button.
Click on the button highlighted below to tell Excel where the predictor data is (Job Satisfaction and Motivation).
Highlight the data and labels for both Job Satisfaction and Motivation. Click on the other highlighted button.
Now press OK, because the labels checkbox should already be checked from before.
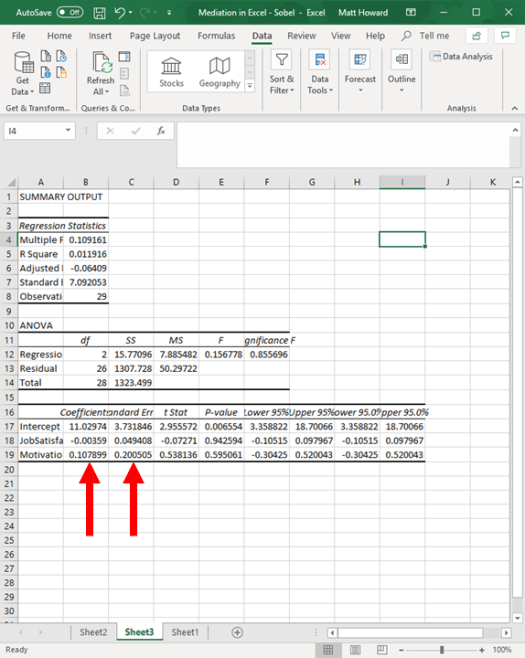
From this data, we can quickly see that neither Job Satisfaction or Motivation were significant in predicting Job Performance (p < .05). In this output, though, we will want to write down the unstandardized beta and standard error of Motivation’s effect. Make sure you don’t forget!
So, we conducted both regression analyses, but we still need to calculate the Sobel test. Unfortunately, Excel cannot calculate this for us. Fortunately, there are many online calculators that can calculate it for us!
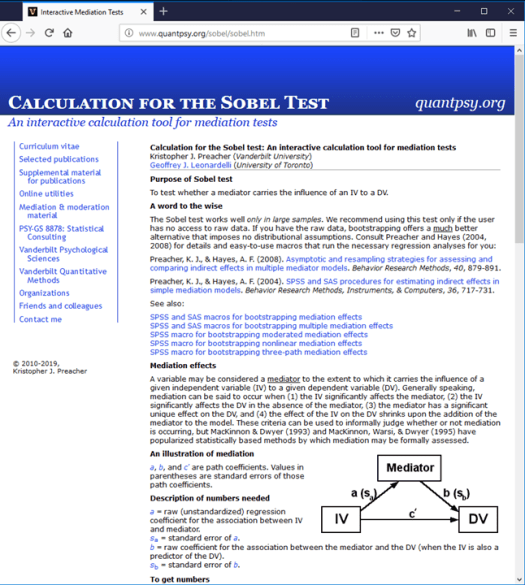
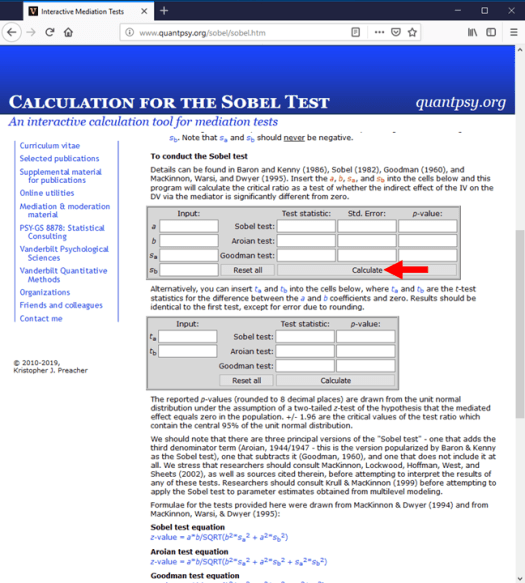
Click the following link to get to the Sobel test calculator seen below: http://www.quantpsy.org/sobel/sobel.htm . Does the page look like the image below?
Scroll on down until you get to the calculator window. We want to fill in the Input boxes within the calculator.
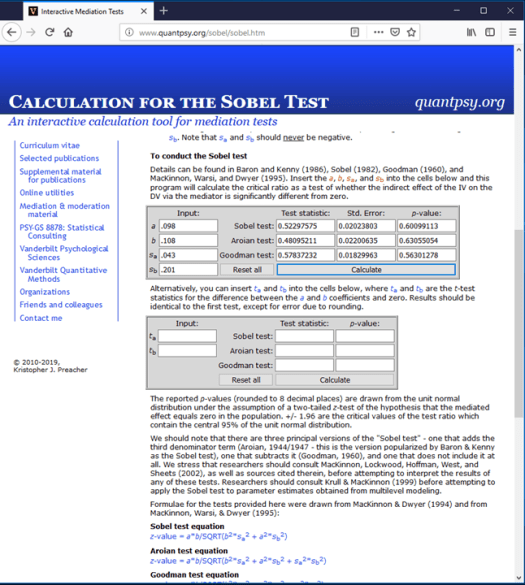
In the A and Sa boxes, we want to enter the unstandardized beta and standard error for the effect of the predictor on the mediator. In the current example, this was the numbers that we wrote down for Job Satisfaction’s effect on Motivation (the first regression). So, in the A box, enter the unstandardized beta for Job Satisfaction from the first regression. In the Sa box, enter the standard error for Job Satisfaction from the first regression.

In the B and Sb boxes, we want to enter the unstandardized beta and standard error for the effect of the mediator on the outcome. In the current example, this was the numbers that we wrote down for Motivation’s effect on Job Performance (the second regression). So, in the B box, enter the unstandardized beta for Motivation from the second regression. In the Sb box, enter the standard error for Motivation from the second regression.
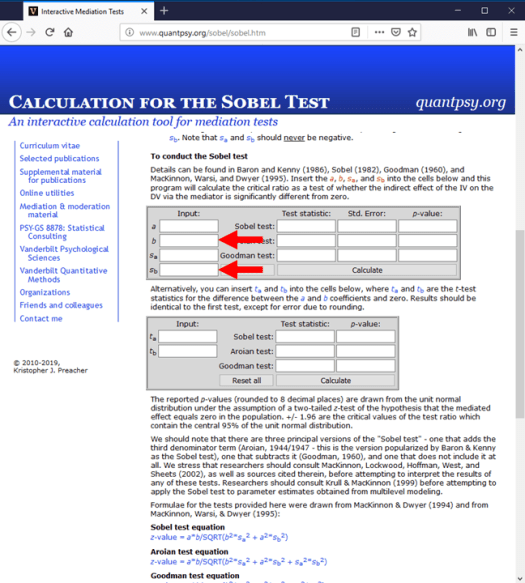
After you enter those numbers, hit the calculate button.
The image below includes all the numbers that you should have entered. See whether your numbers match the correct numbers. If not, go back and see where you may have went astray.
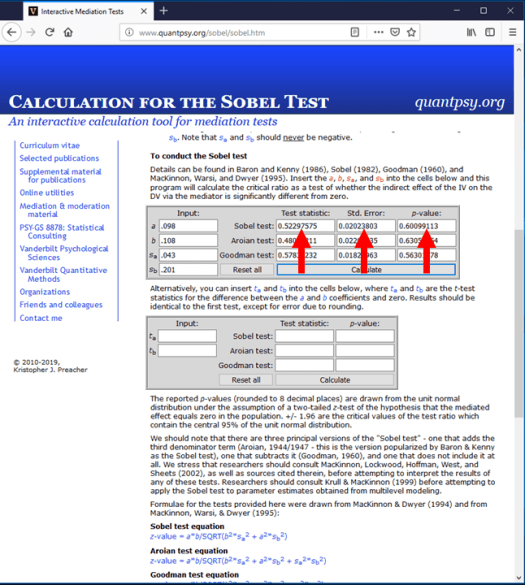
Once you hit calculate, the top row of the calculator gives you the Sobel Test results. From here, we can see the test statistic, standard error, and the p-value. To determine whether the mediating effect is significant, we would look at the p-value from the Sobel Test row. From looking at this value, we can see that there was NOT a significant mediating (or indirect) effect (p < .05).
Together, from our analyses, we found that. . .
- Job Satisfaction had a significant effect on motivation.
- Motivation did NOT have a significant effect on Job Performance.
- And there was NOT a significant mediating effect of Job Satisfaction on Job Performance via Motivation.
That is all for Mediation with Regression in Excel via Sobel Testing! If you have any questions, be sure to contact me at MHoward@SouthAlabama.edu.
