
A good starting point to performing statistical analyses in R is to learn how to conduct correlation analyses, and the current page provides a review on how to do so. Before reading this page, however, you should be familiar with importing your data to R. If you are not, go check out my page on importing your data to R. If you have any questions or comments about anything in R, feel free to email me at MHoward@SouthAlabama.edu. I am always happy to answer your questions.
Calculating correlations in R is very easy – much easier than even importing your data to R. Below provides a easy guide on calculating correlations in R using an example dataset. If you need a dataset, click here to download the example dataset. Be aware, however, that this dataset is in the .xlsx format, and the current guide requires the file to be in .csv format. For this reason, you must convert this file from .xlsx format to .csv format before you can follow along using this dataset. If you do not know how to do this, please visit my page on converting a file to .csv format. After converting the file, you can continue with this guide
First, you must import your data to R. For the current examples, we are going to label our data as: MyData.
Once your data is imported, create a new line in your syntax (input) window by pressing enter. Then, type in: cor( .
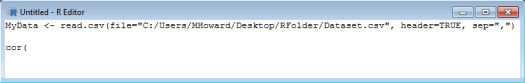
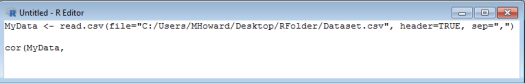
This is the command that we’ll be using. Then, you need to type in the name of your data, followed by a comma. In the current example, we would type: MyData, .
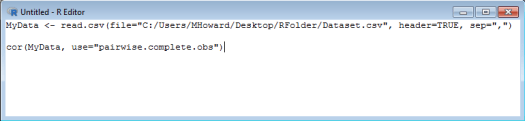
And then we need to tell R how to handle missing data for our correlation. Probably the easiest method is to type: use=”pairwise.complete.obs” . This tells R to use a pairwise deletion method to handle missing data. If you don’t know what this means, that is okay for now. But be sure to look up missing data techniques in the future!
Also, we can go ahead and close our parenthesis, which you should do.
Now, just highlight your correlation command, right click, and then press Run line or selection.
NOTE: Those using Mac versions of R may instead have to run the Execute command. I believe this can be found in the Menu bar (the options at the top of the screen) of R, but you may be able to find Execute by right-clicking. Either way, keep your fingers crossed!


Did you get something like the window above? If so, great! You just calculated your correlation matrix! If not, then go back through and try to figure out what happened.
But, how can we determine whether our correlations are statistically significant? A very easy method is to plus these results into a correlation p-value calculator. My favorite website to find the p-value of a correlation is the following: http://www.socscistatistics.com/pvalues/pearsondistribution.aspx . Just enter your correlation and your sample size, then click Calculate. For the current example, our sample size is 339. So, to calculate the p-value for the correlation between Var1 and Var2, we would enter .062 for the R Score and 339 for the N. We would then press calculate.
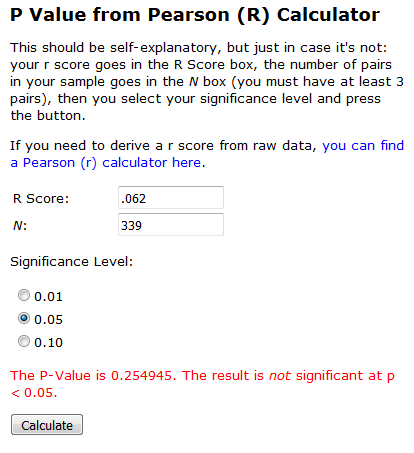
From this result, we can see that our p-value is > .05. So, our correlation is not statistically significant. Go ahead and try to calculate the p-values for the other correlations. For more practice and information about this calculator, just visit my page on calculating a correlation in Excel. It’s a very useful tool!
Now you should be able to calculate a correlation and obtain a p-value using R. If you have any questions or comments, just email me at MHoward@SouthAlabama.edu!
