
Many student’s first exposure to inferential statistics is the correlation. Because these students are getting used to statistics in general, correlations can be hard to understand. This page is a brief lesson on how to calculate a set of correlations in SPSS. As always, if you have any questions, please email me at MHoward@SouthAlabama.edu!
Correlations identify a linear relationship between two variables. In other words, correlations can tell you the relatedness of two things, and correlations can be used to answer the following questions and similar others:
- What is the relationship between job satisfaction and job performance?
- What is the relationship between hours studied and test grades?
- What is the relationship between size of university and number of basketball team wins?
Of course there is more nuance to correlations, but we will keep it simple for this post. Anyways, to answer these types of questions, we can use SPSS to calculate correlation coefficients. If you don’t have a dataset, you can download the example dataset here. In the dataset, we are investigating the relationships job satisfaction, self-efficacy, and job performance.
The data should look something like this:

If your dataset looks differently, you should try to reformat it to resemble the picture above. The instructions below may be a little confusing if your data looks a little different.
Once you have the data open, the first step is to click on the Analyze tab, as seen below:

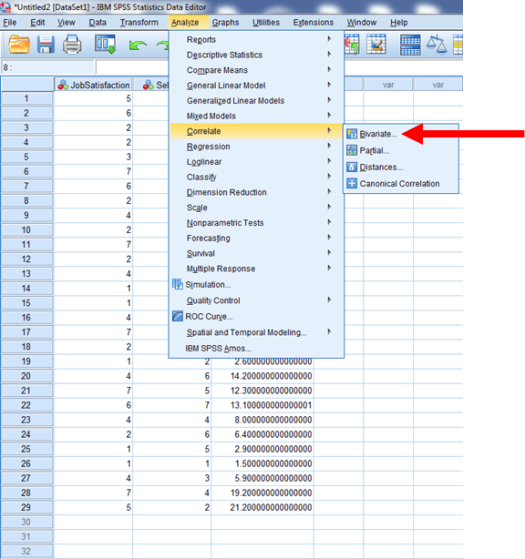
Then Correlate…
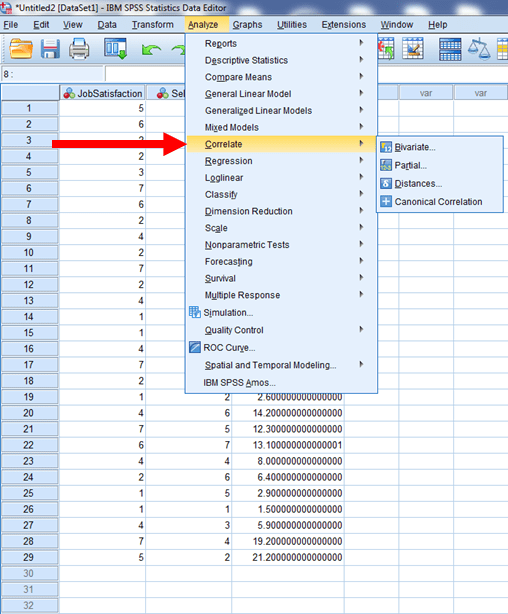
Then Bivariate…
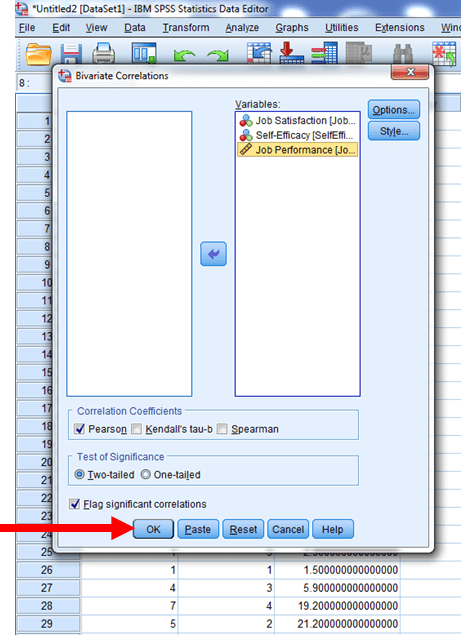
Now, a window like this should pop up:
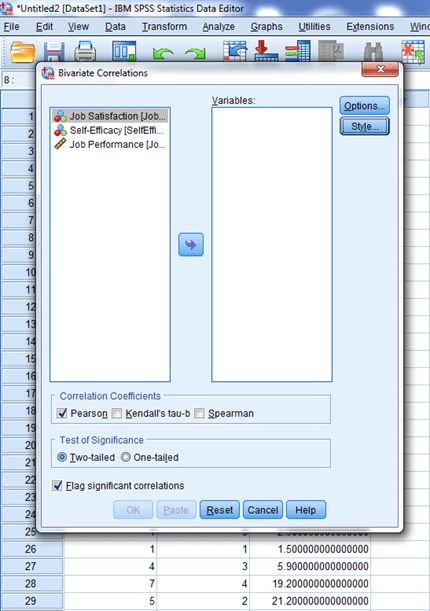
You’ll want to click on each variable that you’re interested in, then click on the arrow to put the variables in the other window. You can do this one at a time, or you can highlight them all at once then click on the arrow.
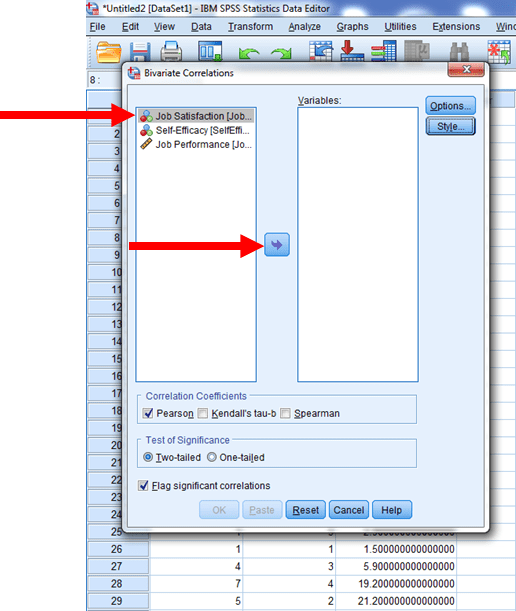
Your final window should look like the following, and then you should push OK.
Now we get results! When reading the table below, pay close attention to where the column meets the row. The number where the self-efficacy Pearson correlation row and the job satisfaction column intersect is .16. This means that there is a .16 correlation between job satisfaction and self-efficacy. Neat!
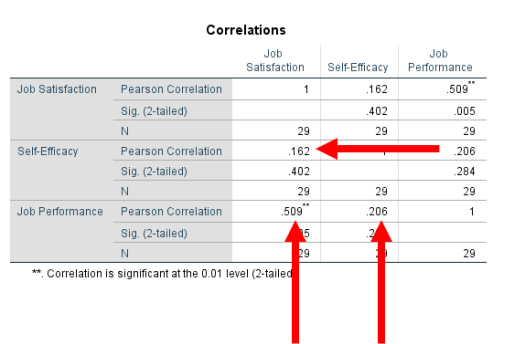
So, from these results, we can determine that…
- Job satisfaction and self-efficacy have a correlation of .16.
- Job satisfaction and job performance have a correlation of .51.
- Self-efficacy and job performance have a correlation of .21.
But, how can we tell whether these are statically significant? We just look at the Sig. rows.
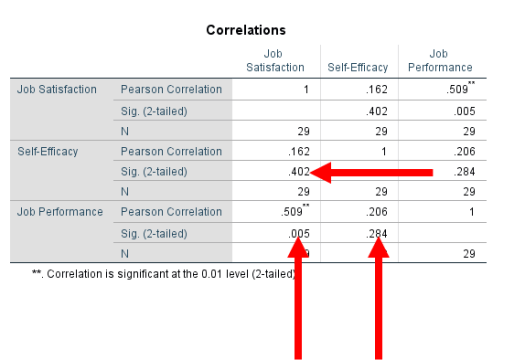
From this, we can see that our p-value for the self-efficacy and job satisfaction correlation is .40. This is much greater than .05, so we would say that the relation of self-efficacy and job satisfaction is not statistically significant. If we were to do the others, the p-value for job performance and job satisfaction is .005, whereas the p-value for job performance and self-efficacy is about .28. This means that the former is statistically significant, whereas the latter is not. Neat!
Now you should be able to perform a correlation in SPSS. As always, if you have any questions or comments, please email me a MHoward@SouthAlabama.edu!
