
Sometimes we are interested in determining whether the number of people in specified groups significantly differs. In these cases, it would be most appropriate to apply the chi-square statistical test. The current page provides a step-by-step guide in calculating a chi-square test in R. As always, if you have any questions, please email me a MHoward@SouthAlabama.edu!
A chi-square test is used to determine whether the number of people in specified groups significantly differs. So, a chi-square test could be used to answer questions that are similar to the following:
- Does the number of males and females differ in Dr. Howard’s class?
- Does the number of people significantly differ in geographic regions?
- Does the number of people differ in four training groups, the four factories that they each were applied at, and the combination of training program and location?
Now that we know what a chi-square test is used for, we can now calculate a chi-square test in R. To begin, open your data in R. If you don’t have a dataset, download the example dataset here. In the example dataset, we are simply comparing the number of people in two different grouping variables, each with three different groups. You can imagine that the groups are anything that you want.
Also, this dataset is in the .xlsx format, and the current guide requires the file to be in .csv format. For this reason, you must convert this file from .xlsx format to .csv format before you can follow along using this dataset. If you do not know how to do this, please visit my page on converting a file to .csv format. After converting the file, you can continue with this guide.
First, you must import your data to R. For the current examples, we are going to label our data as: MyData. For a more in-depth review of opening data in R, please visit my guide on the topic.

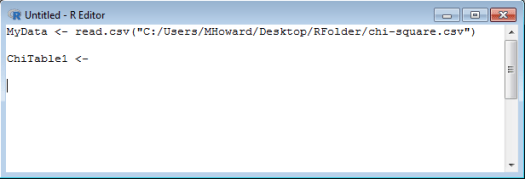
Before conducting the chi-square test, we must convert our data to a table format. This is because the command that we’ll be using, chisq.test(), requires input data to be in this format. So, we should first type in a name to our table format data, followed by an: <- .
Now, we are going to use the table() command, using the variable Grouping1 from our imported dataset. To do so, we will type: table(MyData$Grouping1) .

To conduct a chi-square test on our Grouping1 variable, we are going to use the chisq.test() command and our table format data. Type: chisq.test(ChiTable1) .
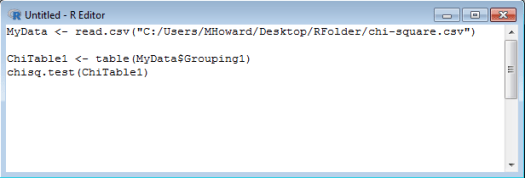
Run your syntax.

From the results, we can see that the chi-square statistic is 0. We can also see that the p-value is not statistically significant (p > .05). So, we would say that there is not a significant difference in the distribution of people within the groups of this grouping variable. In other words, there is a roughly equal distribution of people across each of the groups.
Now, try to run the same analysis for the second grouping variable. Follow the instructions above (but change the syntax to target the second grouping variable) or copy the syntax provided below.

Now run this syntax.
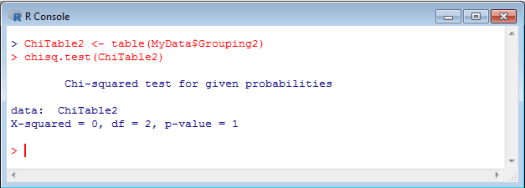
Again, from this result, we can see that the chi-square statistic is 0. We can also see that the p-value is not statistically significant (p > .05). So, we would say that there is not a significant difference in the distribution of people within the groups of the second grouping variable. In other words, there is a roughly equal distribution of people across each of the groups within the second grouping variable.
But there is one last thing we need to test – the interaction! If an interaction exists, the distribution of people depends on both grouping variables together.
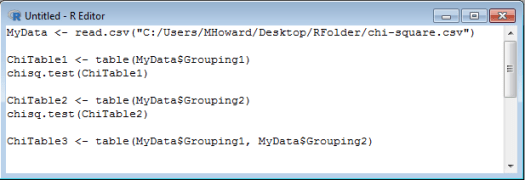
To test this, we must convert our data to table format again; however, this time we would include both variables. To do this, we would label our new table format data, such as ChiTable3. Then, we would include an: <- . Lastly, we would use the table() command, and we would input our Grouping1 and Grouping2 variables separated by a comma. All of this can be seen in the last line of the syntax below:
Lastly, we once again use the chisq.test() command, targeting the new table format data.

Run your syntax.
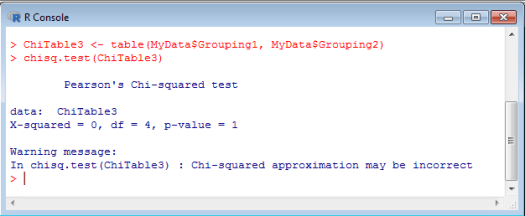
As you can see, there is a warning message. The chisq.test() command provides a warning when the number of observations in a group is very small (e.g. < 5). Sometimes this can provide inaccurate results; however, I double checked the results for the current example, and they are correct.
So, when looking at the results, we can see that the chi-square statistic for the interaction term is 0. We can also see that the p-value for the interaction term is not statistically significant (p > .05). Therefore, there is not a significant interaction between the two grouping variables, and the effect of one does not depend on the effect of the other.
From all that work, nothing was statistically significant. . .but I hope you at least learned how to calculate a chi-square test in R. If you have any questions or comments, please email me at MHoward@SouthAlabama.edu!
