
Sometimes we are interested in determining whether the number of people in specified groups significantly differs. In these cases, it would be most appropriate to apply the chi-square statistical test. The current page provides a step-by-step guide in calculating a chi-square test in SPSS. As always, if you have any questions, please email me a MHoward@SouthAlabama.edu!
A chi-square test is used to determine whether the number of people in specified groups significantly differs. So, a chi-square test could be used to answer questions that are similar to the following:
- Does the number of males and females differ in Dr. Howard’s class?
- Does the number of people significantly differ in geographic regions?
- Does the number of people differ in four training groups, the four factories that they each were applied at, and the combination of training program and location?
Now that we know what a chi-square test is used for, we can now calculate a chi-square test in SPSS. To begin, open your data in SPSS. If you don’t have a dataset, download the example dataset here. In the example dataset, we are simply comparing the number of people in two different grouping variables, each with three different groups. You can imagine that the groups are anything that you want.
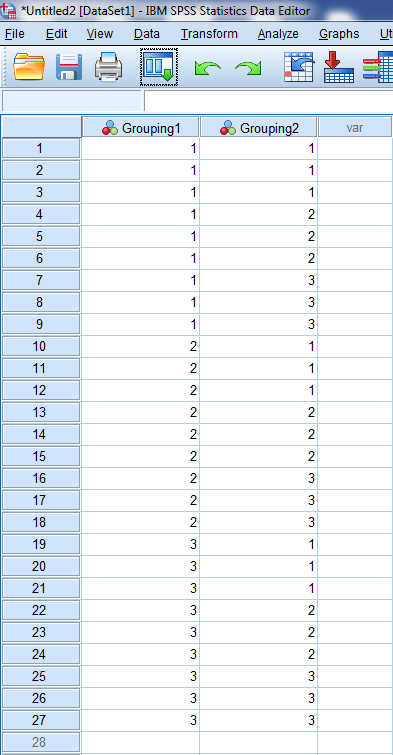
If your data doesn’t look like this, you should probably reformat it to appear similarly. Calculating an ANOVA in SPSS may be a little difficult with different data formats.
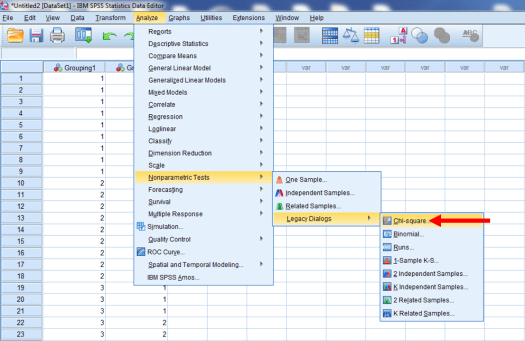
Like most analyses in SPSS, we are going to start by clicking the Analyze tab at the top,then Legacy Dialogs, and then Chi-square.
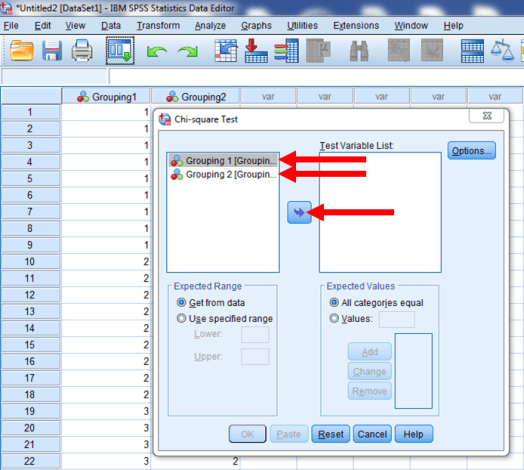
If it worked, the following window should have appeared. You’ll want to include both your grouping variables in the Test Variable List. So, click on Grouping 1 and Grouping 2, and then click on the highlighted arrow.
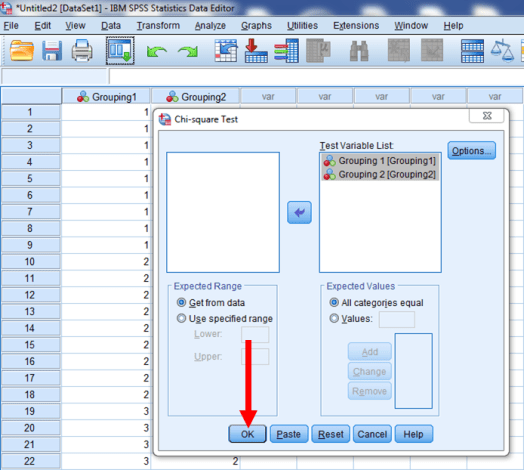
Then press OK.
You should receive results. Great!
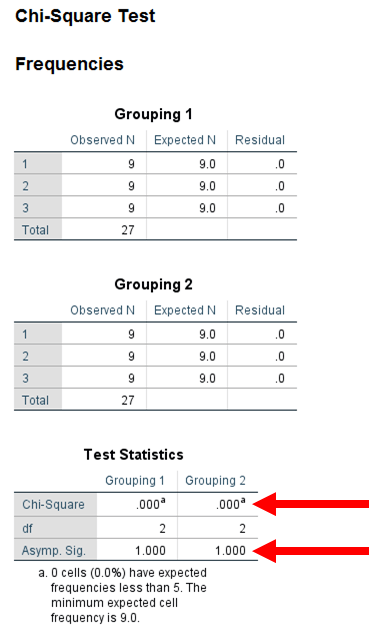
From the results below, we can see that the chi-square statistic for both groups is 0. We can also see that the p-values for both groups are not statistically significant (p > .05). So, we would say that there is not a significant difference in the distribution of people within the groups of both grouping variables independently. But how can we determine whether there is a significant interaction effect, such that the distribution of people depends on both grouping variables together?
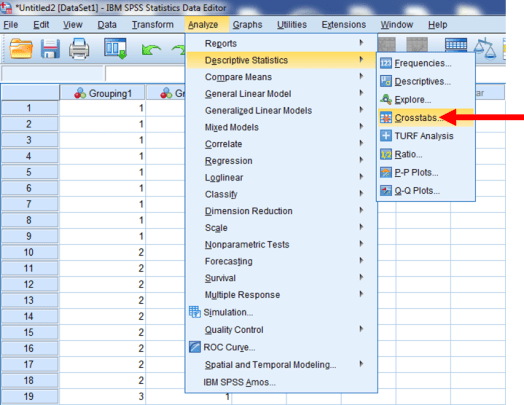
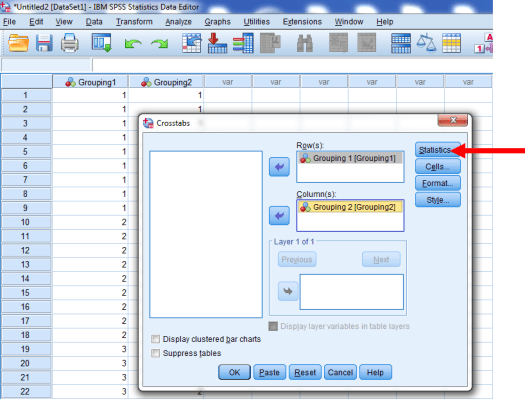
To determine whether a significant interaction effect exists, go to the Analyze tab at the top, then Descriptive Statistics, and then Crosstabs.
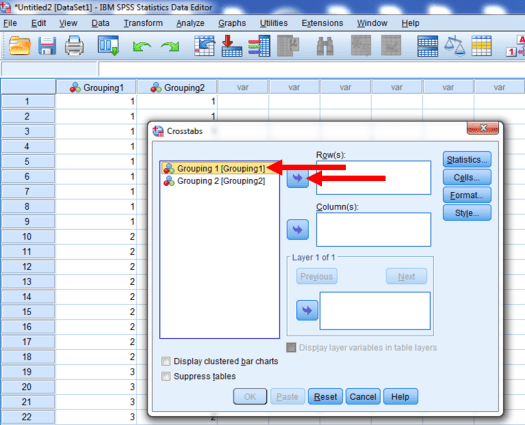
Next, put one of your grouping variables as the row. In the current example, just click on Grouping 1 and then click on the highlighted arrow.
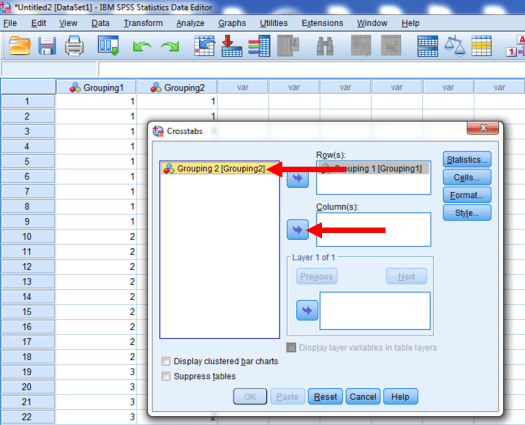
Next, we want to put the other grouping variable as our column. So, click on Grouping 2 and then click on the highlighted arrow below.
Afterwards, click on the Statistics button.
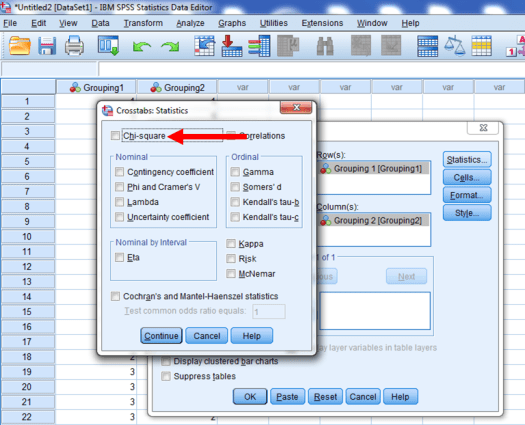
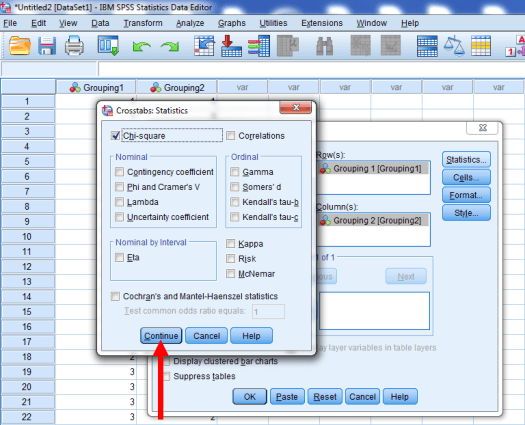
And in the new window, click on the chi-square box.
Then click on Continue.
And then OK.
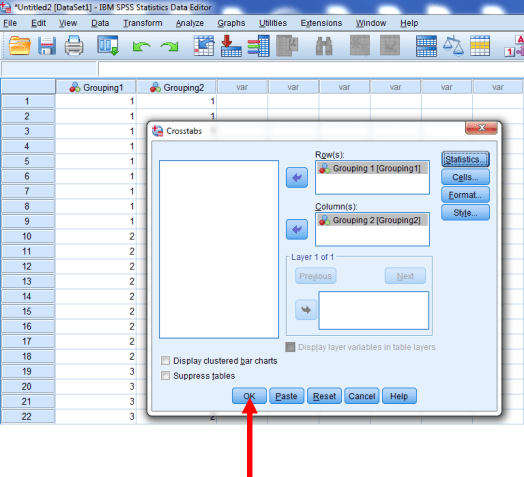
We should have results. Nice!
From the results below, we can see that the chi-square statistic for our interaction is again 0, and our p-value is again not statistically significant (p > .05). This suggests that there is not a significant interaction between Grouping 1 and Grouping 2 in regards to the distribution of participants.

That’s all for chi-square in SPSS! As always, if you have any questions, please email me a MHoward@SouthAlabama.edu!
