
Using scales to measure constructs is widespread in the social sciences and beyond. To support the application of these scales, researchers and practitioners need to show evidence of appropriate reliability and validity. Many different types of reliability exist, but internal consistency reliability is perhaps the most popular. Even yet, many metrics exist to provide evidence of internal consistency reliability, but Cronbach’s alpha is perhaps the most popular of these. For this reason, I provide a guide below of how to calculate Cronbach’s alpha in R. If you have any questions or comments after reading, please contact me at MHoward@SouthAlabama.edu.
Typically, I begin my guides with a brief review of the statistic; however, one of my prior Ph.D. students, Chad Marshall, wrote a fantastic introduction to Cronbach’s alpha which was previously featured on MattCHoward.com. If you need to learn more about Cronbach’s alpha, click here to read it.
Once you are familiar with Cronbach’s alpha, we can then use R to calculate it. If you need a dataset, click here to download the example dataset. Be aware, however, that this dataset is in the .xlsx format, and the current guide requires the file to be in .csv format. For this reason, you must convert this file from .xlsx format to .csv format before you can follow along using this dataset. If you do not know how to do this, please visit my page on converting a file to .csv format. After converting the file, you can continue with this guide
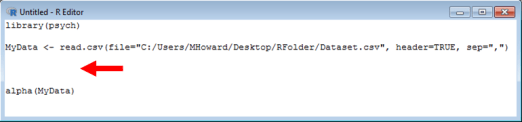
There are two things that you first need to do before we type our syntax to calculate a Cronbach’s alpha. First, you need to install the psych package. If you do not know how to install packages, then you should read my page on installing packages in R. Second, you need to import your data. If you do not know how to import data in R, then you should read my page on importing data in R. Once you have done those two things, your syntax should look something like this:

As seen above, we activate our package in the first line, and we input our data in the following line.
Now, to calculate a Cronbach’s alpha, our syntax is very simple. We just need to type in: alpha( . Then we enter the name of our data, followed by closing our parenthesis. This should result in something similar to the syntax below:

Now, let’s highlight everything and run it. We should get something that looks like:

Success! We got a (terrible) Cronbach’s alpha of .035. . .But what exactly did this syntax do? Well, the syntax calculated the Cronbach’s alpha of each variable in the dataset together. This can be helpful if your dataset only includes a single scale, but our datasets typically include multiple scales and we want to calculate a separate Cronbach’s alpha for each of them. So what do we do?
Well, we can add a little bit of code after importing our data that can separate our scales in the dataset. To do this, we must first know which columns contain data for which scales. For instance, we must know that columns 1, 2, and 3 contain data for Scale 1, whereas columns 4, 5, and 5 contain data for Scale 2.
To separate our scales and calculate separate Cronbach’s alphas, first add some line space between inputting your data and calculating the Cronbach’s alpha.
Then, you first want to type in the name of the scale for which you will calculate the Cronbach’s alpha. For the current example, we will type: Scale1 <- . This indicates that we will assign data to the label “Scale1.”

Then, we want to type the following: data.frame( . This is the command that we will be using.

The data.frame() command allows us to create a dataset, but we need to tell it what data to use. To use certain columns of our original dataset, we first type in the label that we are using for our dataset. In the current example, we would type in: Mydata . Then, to reference only certain columns, we would enter an open bracket, followed by a comma: [, . Next, we would type in the first and last column that we want to use, separated by a colon. For instance, if our scale corresponds to columns 1, 2, 3, 4, and 5, we would enter: 1:5 . For the current example, we are only interested in columns 2, 3, and 4. Therefore, we are going to enter: 2:4 . Once we have entered the columns, we can close our bracket and parenthesis by typing: ]). Once completed, our syntax should look like the following:

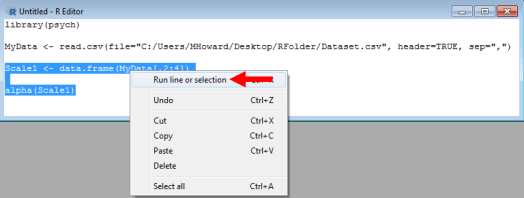
There is one last thing we should change before running our analysis, however. We need to change the reference in the alpha() command to our scale reference. In the current example, we would change MyData to Scale1, as seen below:

Now, we just highlight those last two lines of syntax, right click, and click on “Run line or selection.”
NOTE: Those using Mac versions of R may instead have to run the Execute command. I believe this can be found in the Menu bar (the options at the top of the screen) of R, but you may be able to find Execute by right-clicking. Either way, keep your fingers crossed!

Great! We got a much better (but still pretty low) Cronbach’s alpha of .57. Did you get output that looked like the picture above? If so, wonderful! You calculated the Cronbach’s alpha for your scale. Good work! If not, try again and maybe even look at other sources. If that still doesn’t work, email me at MHoward@SouthAlabama.edu. I can try to help!
